U.S. Single-Family Rents

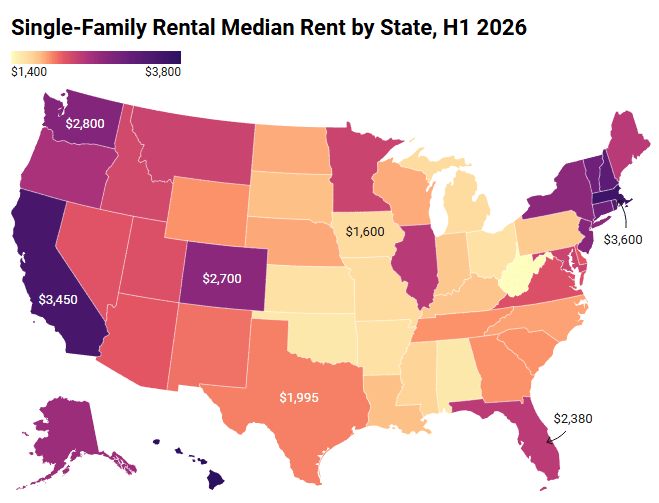
The U.S. single-family rental market continued to cool during the first half of 2026, with the national median rent reaching $2,100, down 1.6% year-over-year.
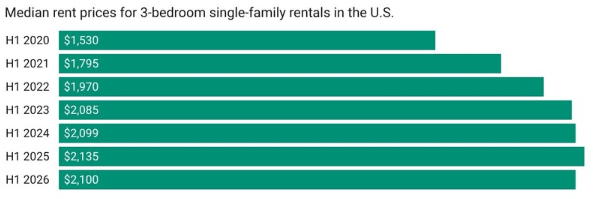
Rents increased by approximately 1.7% during the first half of 2025 but began declining during the second half of the year, effectively erasing those gains by year-end. That softer pricing environment has carried into 2026.
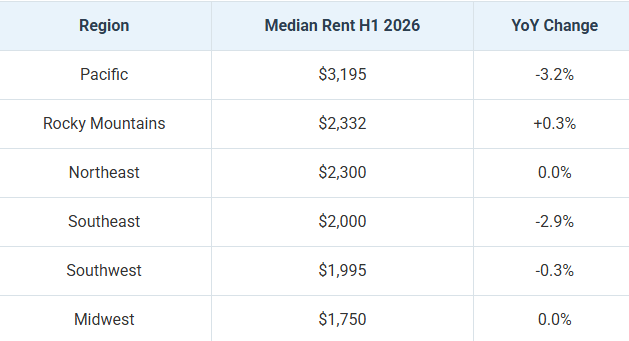
Another notable feature of the first half of the year was the absence of the typical seasonal lift. The national median rent remained unchanged at $2,100 in both the first and second quarters, even as the market moved through its traditional peak leasing season.
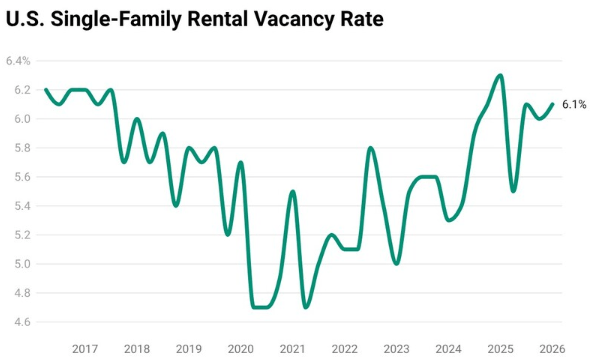
Historically, rents tend to increase during the spring and early summer months as demand picks up. The lack of any seasonal increase suggests pricing momentum remained weak even during some of the year’s busiest leasing months.
Source: Rentometer
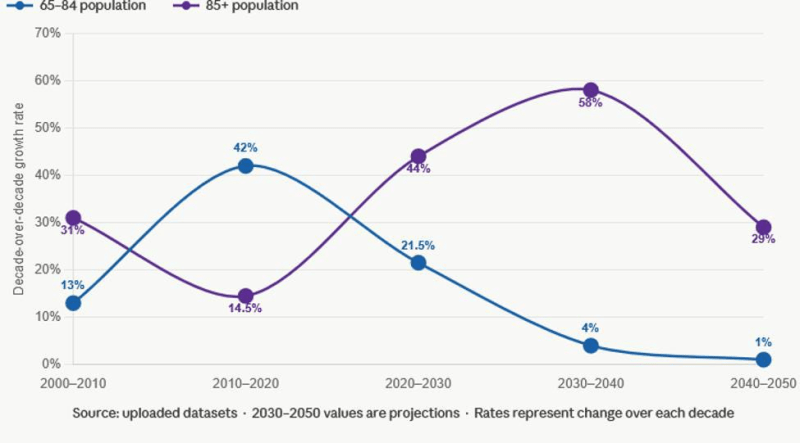
Why The Number Of Americans Aged 85+ Is Already Growing

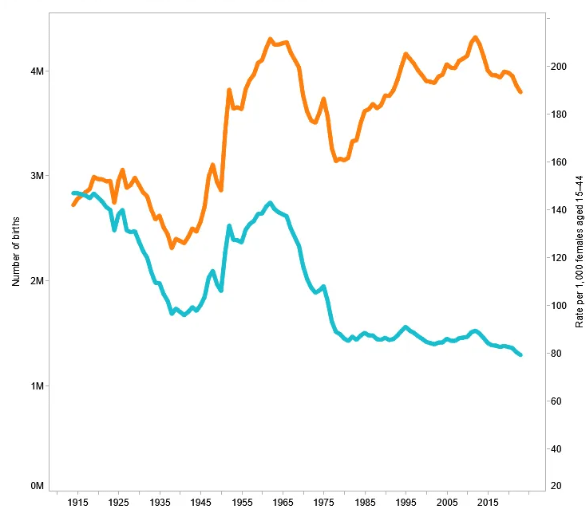
We hit a low point of 2.3 million births in 1933 (following the Great Depression). The babies born during that year are turning 93 this year. The numbers gradually increased after that reaching almost 2.6 million in 1940 and just above or below 2.9 million during the years between 1942 and 1945, babies who are 81 to 84 today.

Then things took off with the number of babies reaching 3.4 million in 1946, the onset of the baby boom, over 4 million by 1954 and a peak of 4.3 million in 1957. They stayed above the 4 million mark through 1964, the last year of the baby boom.

The chart below shows the annual number of births each year in orange (and the birth rate in blue).

The 85+ group will grow by 44% this decade and will skyrocket by 58% during the 2030’s, before slowing to a more moderate 29% growth rate in the 2040’s.

The number of Americans aged 65 to 84 is only projected to grow 21.5% this decade and then essentially stop growing after 2030.

Source: Harry Margolis

Multifamily’s Biggest Competitor: Mom and Dad’s House

From the Wall Street Journal:

Living at home as a 20-something was once viewed as a failure to launch and even a source of embarrassment in a culture that places a premium on independence. That is no longer the case. Living at home is now often viewed as a sign of financial prudence, and for some, a long-term prospect.

Chronically high living costs are helping reshape the milestones of early adulthood in America. The national median home price hovers above $400,000. Rents are at record highs in cities across the U.S., and many recent college graduates are saddled with tens of thousands of dollars in student debt.

Last year, 49% of adults under age 30 said they lived with a parent, up 12 percentage points from 2019. Nearly a third of those adults were 25 or older.

About 55% of young adults who moved back home said it was out of financial necessity. Far from hiding it, some now broadcast their lives as “stay-at-home daughters” or “stay-at-home sons” on social media. 

Multifamily Concessions Offer Deepest Discounts In 25 Years

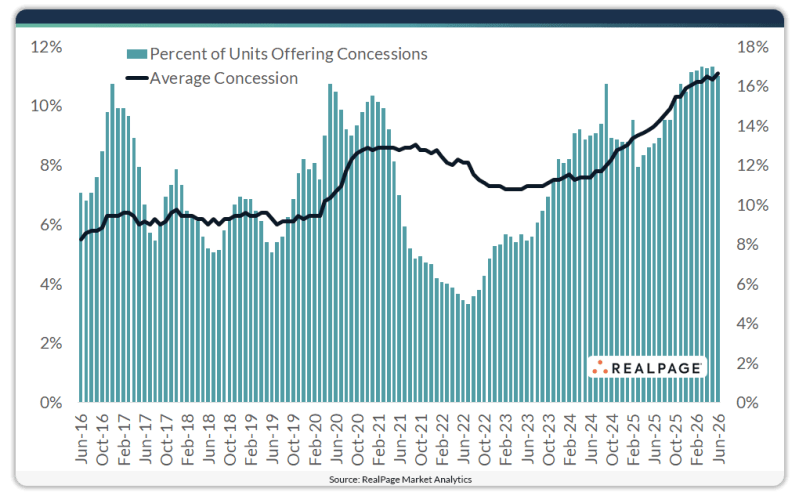
In June, 16.5% of all stabilized units offered concessions, up 3.4 points year-over-year.

The average U.S. concession discount increased 0.2 percentage points month-over-month to 11.1%, marking the deepest discount in more than 25 years. The average discount was also 1.8 points higher than one year ago and translates to nearly six weeks free on a 12-month lease.

Average concession discount by class:

  • Class A – 11.4%
  • Class B – 10.7%
  • Class C – 11.3%

Source: RealPage

Multifamily Absorption Remains Strong

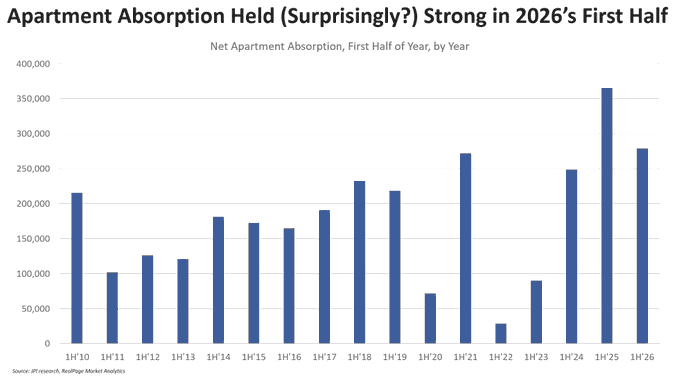
Apartment demand topped expectations in the first half of 2026, with net apartment household formation topping 250,000 units, according to CoStar and Real Page. That’s among the highest absorption starts in history, and it’s better than any year before 2020.

With supply dropping off concurrently, absorption topped supply by about 100,000 units so far this year, reversing a long trend of ultra-high supply topping strong demand. That triggered occupancy growth of 20 basis points in the first quarter of 2026, which was the best for any quarter since 2021.

The absorption trends so far this year are a possible sign that at least one segment of consumers is faring better than generally perceived, especially when these new renters are spending only 21-22% of income toward rent.

Source: Jay Parsons

Historical Multifamily vs. Assisted Living/Memory Care Cap Rates

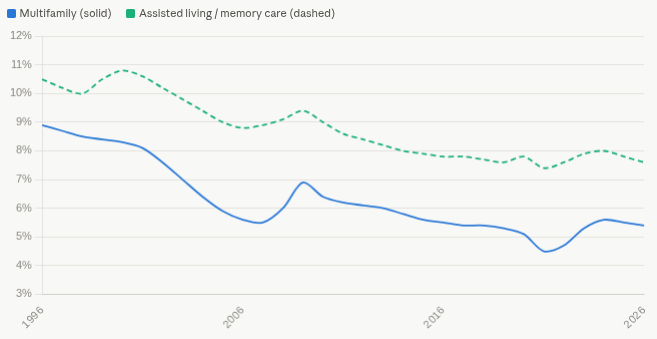
Assisted Living and Memory Care properties have always traded with a cap rate spread above multifamily. Why?

Operating Business Risk

  • An apartment is a passive real estate asset; assisted living/memory care is a healthcare-adjacent operating business inside real estate. Buyers underwrite the operator as much as the building, and NOI can swing dramatically based on management quality.
  • Operator dependence creates transition risk — replacing an underperforming operator is far more disruptive than swapping property managers on an apartment deal.

Labor Intensity

  • Labor runs roughly 55-65% of operating expenses in AL (higher in memory care) versus ~25-30% for multifamily, so wage inflation, caregiver turnover, agency staffing costs, and staffing regulations hit NOI directly.
  • The caregiver labor pool is structurally tight, and owners have limited ability to control that cost line.

Resident Turnover Economics

  • Average length of stay is only 18-28 months in AL and roughly 18 months in memory care, versus 2-3 years for apartment tenants — meaning 40-60% of the rent roll must be re-leased every year just to hold occupancy flat.
  • Move-outs are driven by health decline or death rather than lease expirations, and move-ins depend on emotionally difficult family decisions, making census harder to predict and market.

Regulatory and Licensing Exposure

  • Communities are state-licensed and subject to surveys and inspections; a deficiency citation can damage reputation and census in ways multifamily never faces.
  • Regulations (staffing ratios, care requirements) can change and compress margins with no offsetting revenue.

Liability and Litigation Risk

  • Resident acuity creates negligence and wrongful-death exposure, especially in memory care, driving higher insurance costs and legal risk.

Thinner Capital Markets

  • The buyer pool is smaller and more specialized than multifamily’s, reducing exit liquidity.
  • Debt is less abundant — multifamily enjoys deep, consistent GSE support, while senior housing financing is narrower and more sensitive to credit cycles.

Higher Expense Loads and Margin Sensitivity

  • Food service, care staff, transportation, and activities create a heavier expense structure, so a small revenue miss translates into a larger NOI miss than in multifamily.

Segment Risk Premium Scales with Care Level

  • The market prices this explicitly: active adult trades nearly on top of multifamily, independent living slightly wider, assisted living wider still, and free-standing memory care widest (~9.5%+) — the more care in the model, the bigger the spread.