
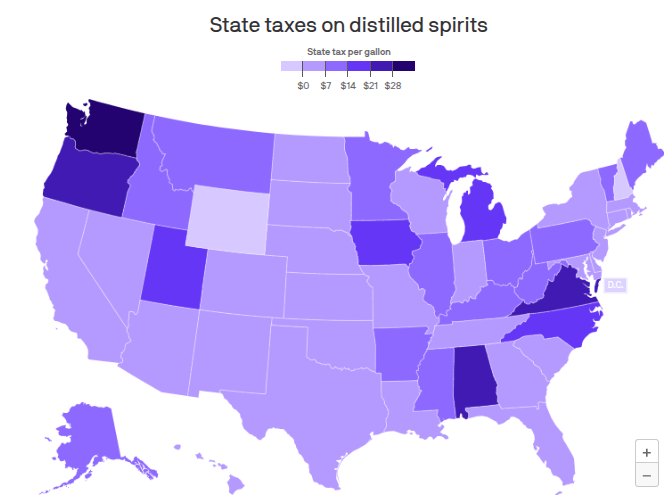
Pretty amazing difference on the NC/SC border:
- North Carolina: $18.23 per gallon
- South Carolina: $5.42 per gallon
Source: Axios
Pretty amazing difference on the NC/SC border:
Source: Axios
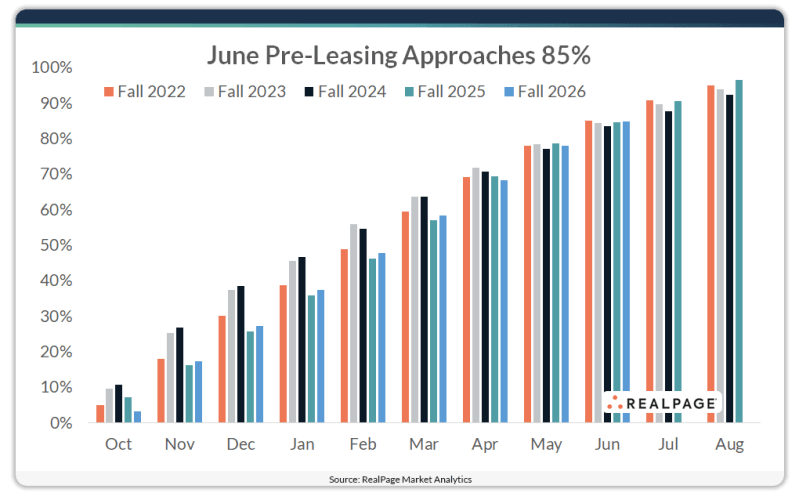
U.S. student housing pre-leasing continued its upward climb in June, with occupancy reaching 84.7% for the Fall 2026 season.
That rate was 340 basis points ahead of the market’s 10-year average June pre-lease level of roughly 81.3% and matched the June 2025 performance.
Source: RealPage
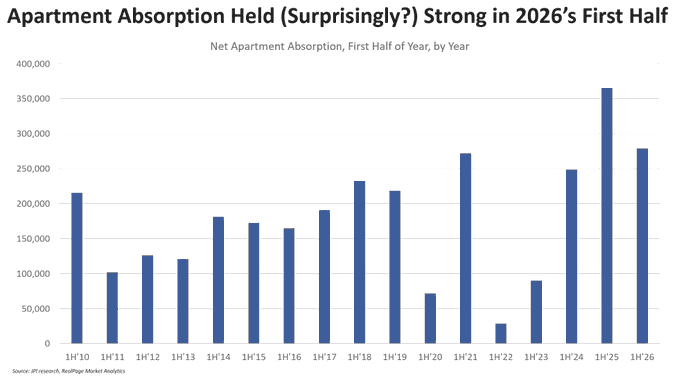
Apartment demand topped expectations in the first half of 2026, with net apartment household formation topping 250,000 units, according to CoStar and Real Page. That’s among the highest absorption starts in history, and it’s better than any year before 2020.
With supply dropping off concurrently, absorption topped supply by about 100,000 units so far this year, reversing a long trend of ultra-high supply topping strong demand. That triggered occupancy growth of 20 basis points in the first quarter of 2026, which was the best for any quarter since 2021.
The absorption trends so far this year are a possible sign that at least one segment of consumers is faring better than generally perceived, especially when these new renters are spending only 21-22% of income toward rent.
Source: Jay Parsons
Apartment vacancies have declined in four straight months, according to Apartment List. That’s the first time that’s happened since 2021. CoStar also reported the Q2 2026 vacancy decline was the largest since 2021.

Source: Jay Parsons
Assisted Living and Memory Care properties have always traded with a cap rate spread above multifamily. Why?
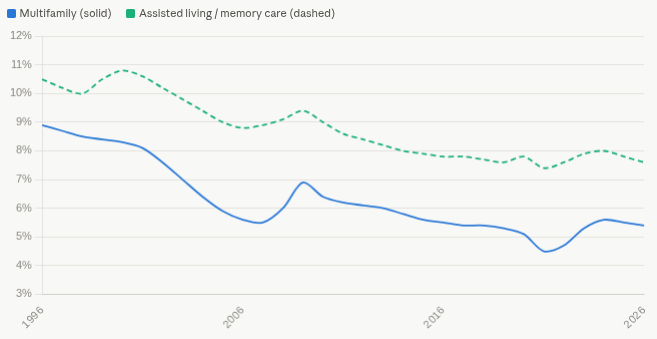
Operating Business Risk
Labor Intensity
Resident Turnover Economics
Regulatory and Licensing Exposure
Liability and Litigation Risk
Thinner Capital Markets
Higher Expense Loads and Margin Sensitivity
Segment Risk Premium Scales with Care Level
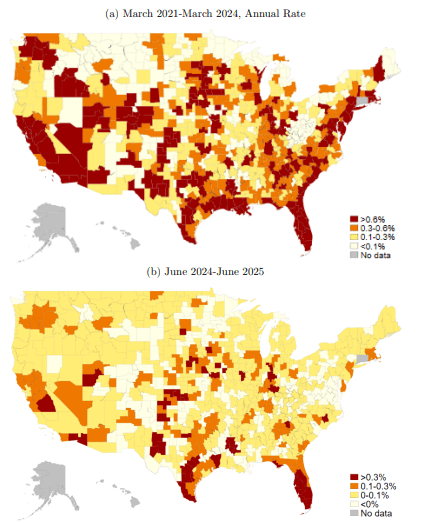
Some highlights from a recent working paper from the Federal Reserve titled: The Impacts of Unauthorized Immigration on U.S. Labor and Housing Markets: New Evidence from Administrative Microdata
From early 2021 to early 2024, the U.S. experienced an unprecedented boom in unauthorized immigration, followed by a rapid slowdown beginning in mid-2024.
Employment Growth: Unauthorized immigrant workers boosted local employment numbers on a roughly one-for-one basis. The surge accounted for roughly 30% of local employment growth in the average metropolitan area.
Wages: Researchers found no evidence that the sudden influx of workers lowered average local wages. However, the report did note a decrease in labor income per capita. This happened because the new workers generally filled lower-wage jobs, shifting the overall workforce average.
Housing Impact: Because the housing supply could not expand fast enough, the surge acted as a major housing demand shock. This influx explained about 30% of home-price growth and 20% of rent growth in the average metropolitan area between March 2021 and March 2024. A 1% increase in unauthorized worker inflows was associated with approximately a 2.2% increase in home prices and about a 1.4% increase in rents.
Most of America is preparing for fewer students and young families, while the South faces the opposite problem: crowded classrooms and new housing needed.
The South’s overall growth reflects strong migration patterns that are adding children, people in prime family-building years and retirees — making it the only region gaining population across all five age groups tracked by the Census Bureau.

Source: Axios
Over the last decade, the share of young non-homeowners saying they will not buy a home in the foreseeable future has more than doubled, from 13% to 30%.
The share expecting to buy within 10 years has risen from 27% to 41%, suggesting younger non-homeowners are pushing their timeline out significantly.

Only 29% say now is a good time to buy a house, while 67% say it is a bad time.

65% expect prices in their area to increase over the next year, up eight percentage points from 2025.
22% of U.S. adults believe prices will stay the same and 12% think they will fall.

Source: Gallup
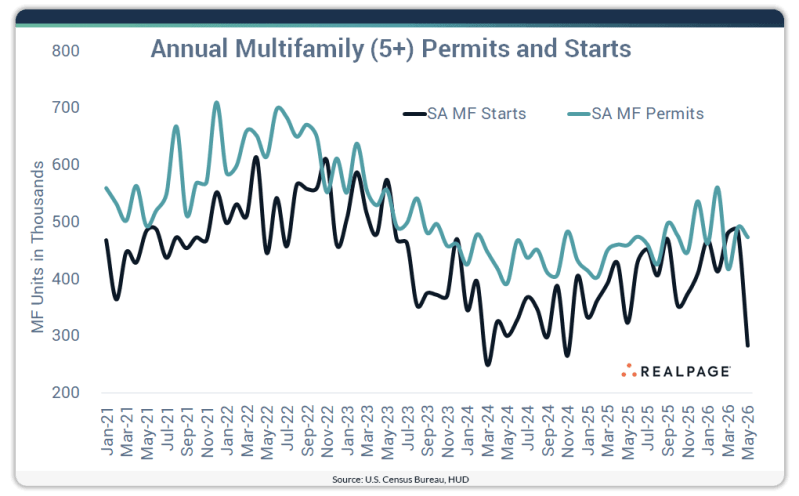
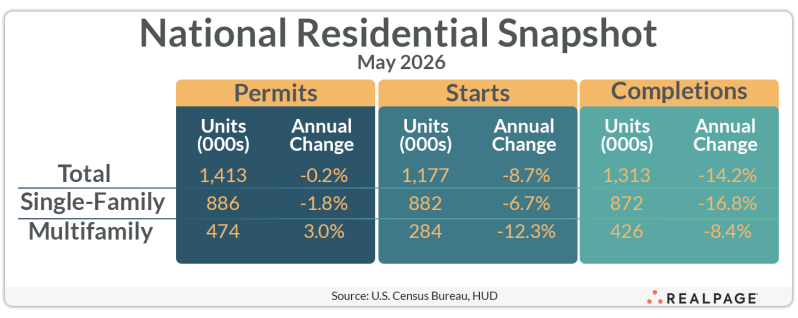
Multifamily starts dropped an incredible 41.6% from April’s revised figure to 284,000 units in May, according to the latest data release from the U.S. Census Bureau and the Department of Housing and Urban Development. That annualized figure is also down 12.3% from last May.
Annualized multifamily starts increased sharply in the small Northeast region (up 70.5% to 56,000 units) and were up 38.7% in the Midwest region to 58,000 units. The South region’s multifamily starts decreased 51.3% to 81,000 units, while the West region saw starts increase modestly (7.6%) to 88,000 units.
Source: RealPage
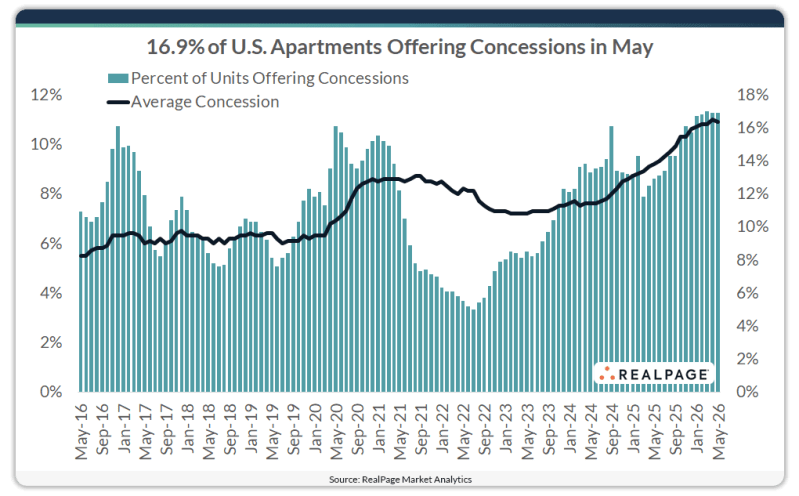
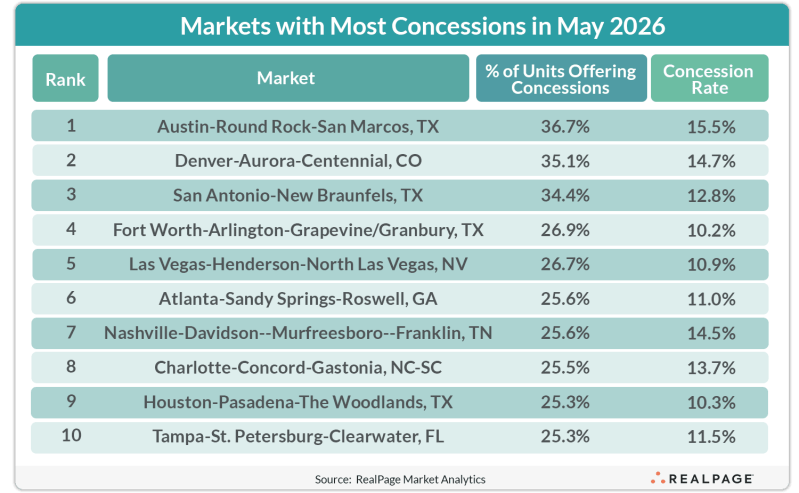
The number of communities offering concessions remained steady at 16.9% in May 2026. While unchanged month-over-month, this concession activity marked a 4-point increase year-over-year and remains near the highest average level of monthly concession activity since mid-2014 (blue bars below).
The average concession (black line below) decreased 0.1 point on a monthly basis to 10.9% in May 2026. While that was a mild dip, it marked the first monthly decline in average concession amounts since March 2024.
Still, May’s 10.9% reading was up 1.7 points year-over-year and translates into nearly six weeks free on a 12-month lease. Overall, U.S. concessions have generally trended upward since reaching a decade low of 5.5% in mid-2016 and remain near their highest level since the post–Great Financial Crisis period (2010).
Overall concession use was once again led by the high-supply South at 22.1%, up 0.3 points month-over-month.
Source: RealPage

