
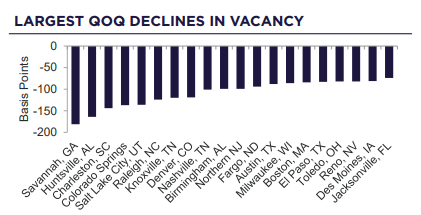
The cities with the largest first quarter to second quarter declines in vacancy:
Source: Cushman & Wakefield
The cities with the largest first quarter to second quarter declines in vacancy:
Source: Cushman & Wakefield
Senior housing occupancy has crossed 90% for the first time since 2007.
The gains are broad-based across property types, including Independent Living (91.5%) and Assisted Living (88.6%).
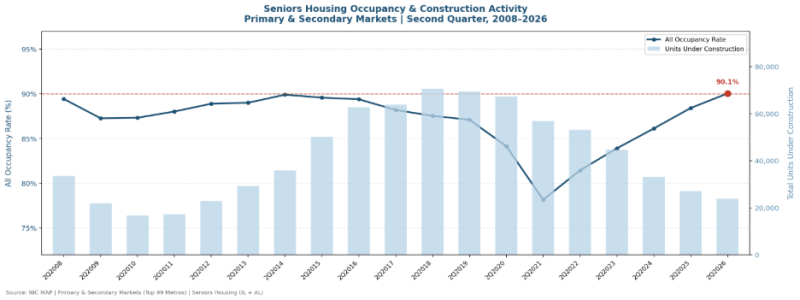
Senior housing units under construction have fallen below 24,000, the lowest level since mid-2012. Add the typical two-year lag from groundbreaking to opening, and substantial inventory growth from any new cycle is unlikely to reach the market before 2030 at the earliest.
Source: NIC MAP
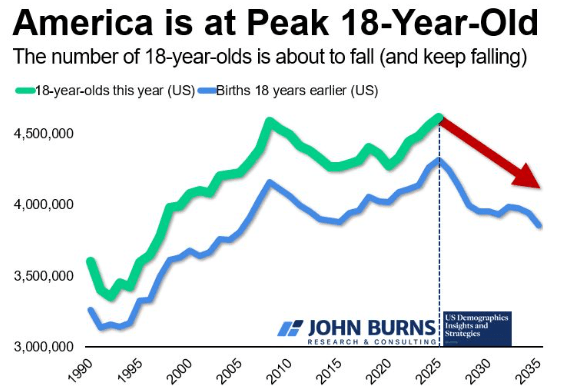
The pool of new high school grads will shrink for at least the next decade. Community planners, architects/designers, and homebuilders should plan for shifting households with fewer bedrooms needed for teens.
Colleges everywhere should know how this demographic reality could affect them and update enrollment forecasts and budgets to match.
Source: Eric Finnigan
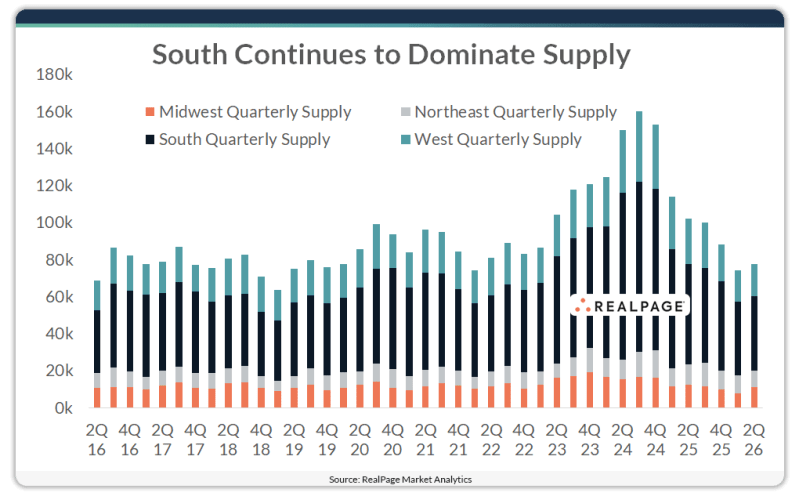
After falling to a four-year low in the first quarter of 2026, apartment deliveries posted a modest uptick in Q2.
The South region continued to account for the largest share of new apartment completions, logging delivery for over 40,000 units during the second quarter. That represented an increase of about 180 units from Q1 but remained far below the region’s peak of over 92,200 units reached in the third quarter of 2024.
Source: RealPage
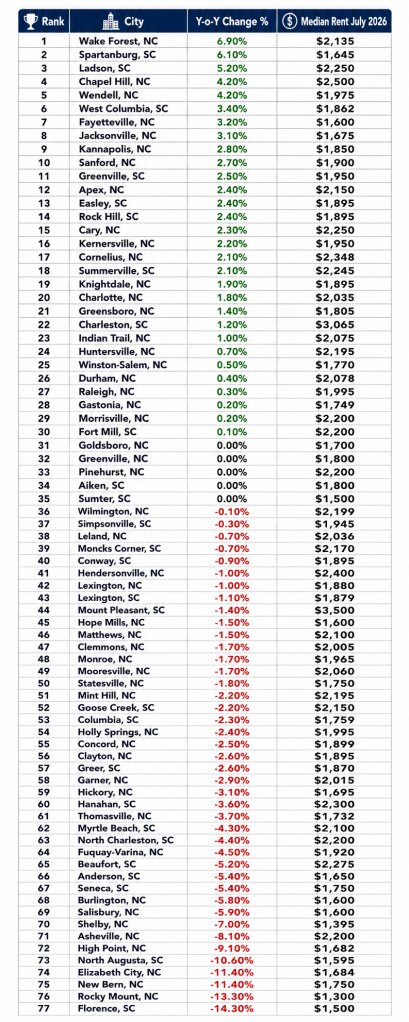
Source: Rentometer
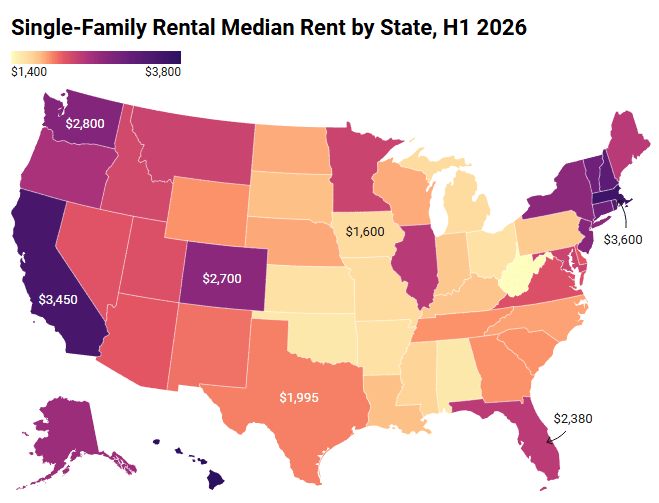
The U.S. single-family rental market continued to cool during the first half of 2026, with the national median rent reaching $2,100, down 1.6% year-over-year.
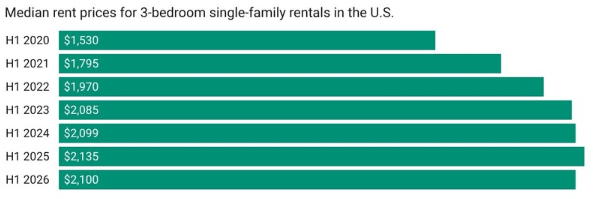
Rents increased by approximately 1.7% during the first half of 2025 but began declining during the second half of the year, effectively erasing those gains by year-end. That softer pricing environment has carried into 2026.
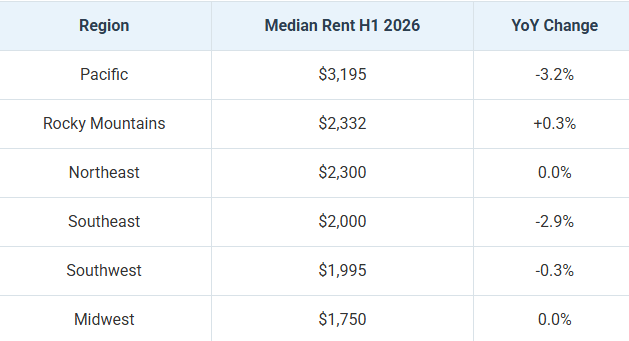
Another notable feature of the first half of the year was the absence of the typical seasonal lift. The national median rent remained unchanged at $2,100 in both the first and second quarters, even as the market moved through its traditional peak leasing season.
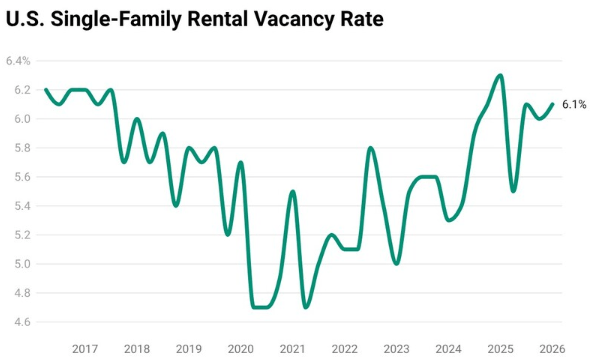
Historically, rents tend to increase during the spring and early summer months as demand picks up. The lack of any seasonal increase suggests pricing momentum remained weak even during some of the year’s busiest leasing months.
Source: Rentometer
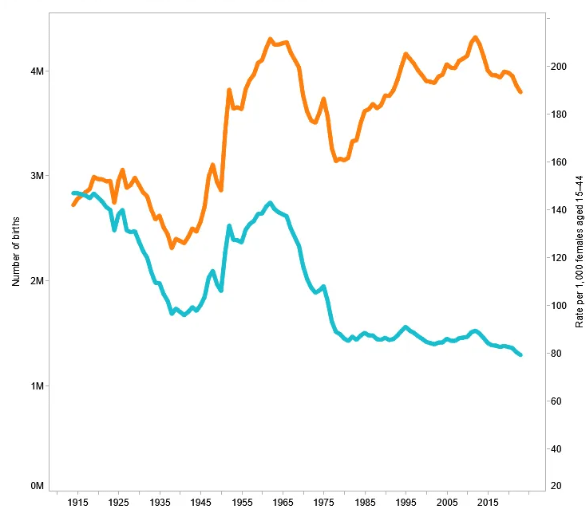
We hit a low point of 2.3 million births in 1933 (following the Great Depression). The babies born during that year are turning 93 this year. The numbers gradually increased after that reaching almost 2.6 million in 1940 and just above or below 2.9 million during the years between 1942 and 1945, babies who are 81 to 84 today.
Then things took off with the number of babies reaching 3.4 million in 1946, the onset of the baby boom, over 4 million by 1954 and a peak of 4.3 million in 1957. They stayed above the 4 million mark through 1964, the last year of the baby boom.
The chart below shows the annual number of births each year in orange (and the birth rate in blue).
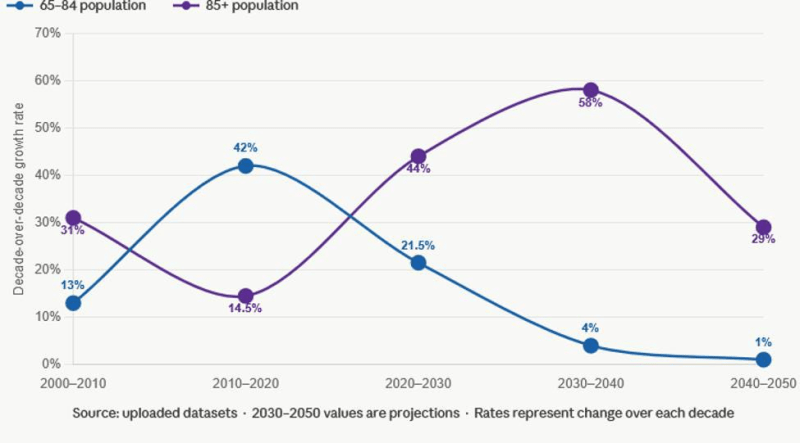
The 85+ group will grow by 44% this decade and will skyrocket by 58% during the 2030’s, before slowing to a more moderate 29% growth rate in the 2040’s.
The number of Americans aged 65 to 84 is only projected to grow 21.5% this decade and then essentially stop growing after 2030.
Source: Harry Margolis
From the Wall Street Journal:
Living at home as a 20-something was once viewed as a failure to launch and even a source of embarrassment in a culture that places a premium on independence. That is no longer the case. Living at home is now often viewed as a sign of financial prudence, and for some, a long-term prospect.
Chronically high living costs are helping reshape the milestones of early adulthood in America. The national median home price hovers above $400,000. Rents are at record highs in cities across the U.S., and many recent college graduates are saddled with tens of thousands of dollars in student debt.
Last year, 49% of adults under age 30 said they lived with a parent, up 12 percentage points from 2019. Nearly a third of those adults were 25 or older.
About 55% of young adults who moved back home said it was out of financial necessity. Far from hiding it, some now broadcast their lives as “stay-at-home daughters” or “stay-at-home sons” on social media.

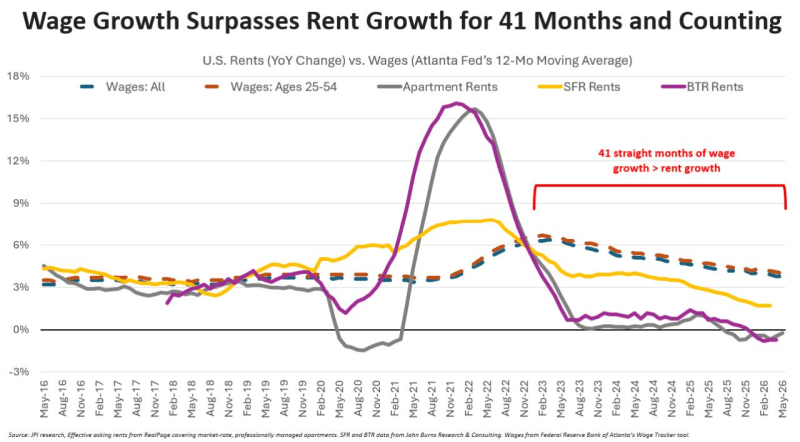
With wage growth outpacing rent growth for 41 consecutive months, rent-to-income ratios are back to pre-pandemic norms around 22%. That’s for renter households signing a new lease in a market-rate apartment.
Source: Jay Parsons
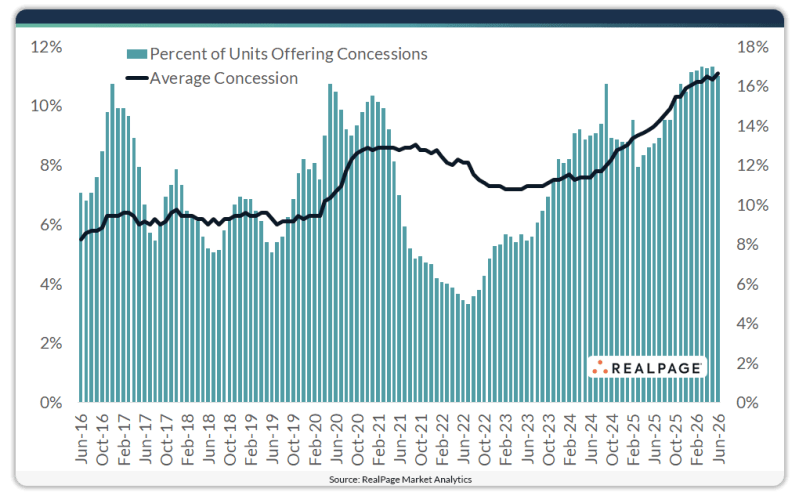
In June, 16.5% of all stabilized units offered concessions, up 3.4 points year-over-year.
The average U.S. concession discount increased 0.2 percentage points month-over-month to 11.1%, marking the deepest discount in more than 25 years. The average discount was also 1.8 points higher than one year ago and translates to nearly six weeks free on a 12-month lease.
Average concession discount by class:
Source: RealPage

