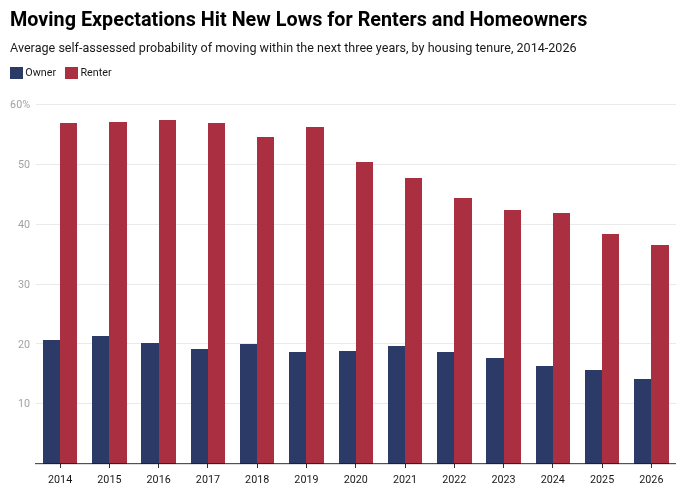
From the Federal Reserve Bank of New York’s 2026 Survey of Consumer Expectations Housing Survey in 2026:
Renters reported a 36.6% average probability of moving within the next three years, down from 57.5% in 2016.
Source: Chandon Economics
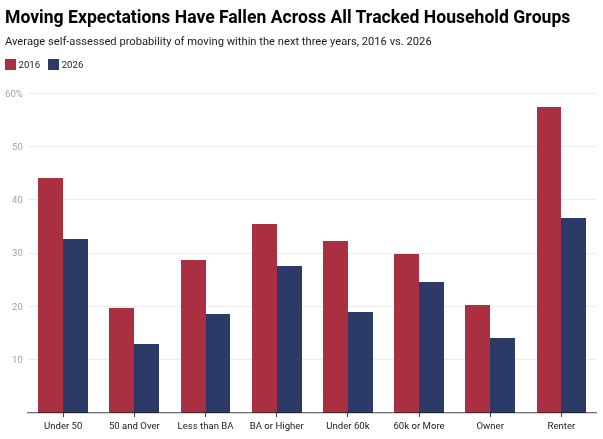
From the Federal Reserve Bank of New York’s 2026 Survey of Consumer Expectations Housing Survey in 2026:
Renters reported a 36.6% average probability of moving within the next three years, down from 57.5% in 2016.
Source: Chandon Economics
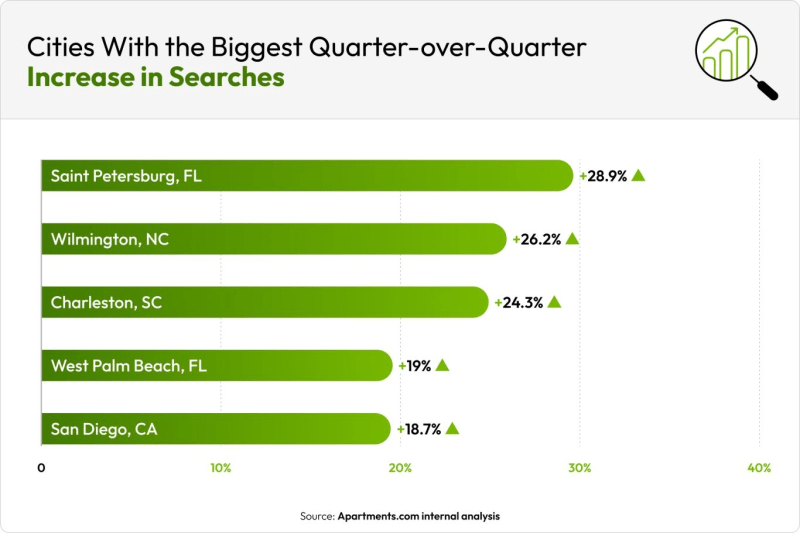
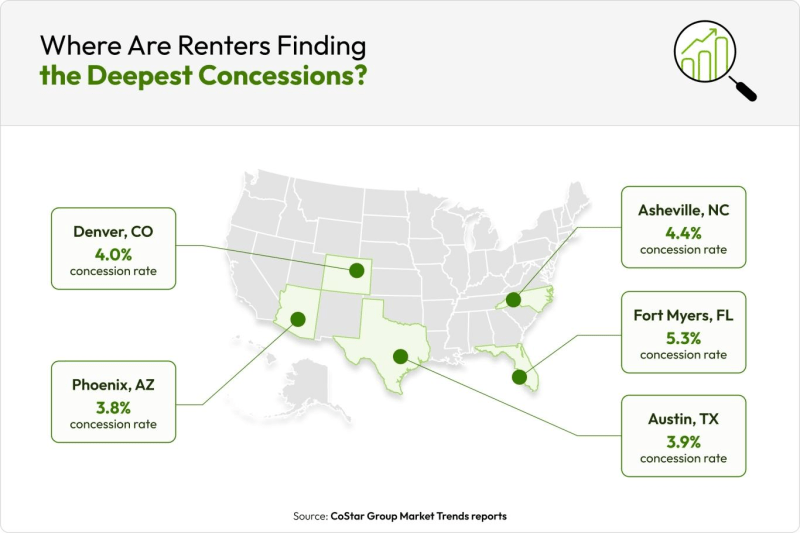
Where renters are searching:
Most affordable cities ranked:
| City | Median Household Income | Current Average One-Bedroom Rent | Rent-to-Income Ratio | |
| 1 | Colorado Springs, CO | $94,742 | $1,299 | 16.5% |
| 2 | Austin, TX | $81,906 | $1,387 | 20.3% |
| 3 | Seattle, WA | $114,915 | $2,092 | 21.8% |
| 4 | Raleigh, NC | $75,944 | $1,383 | 21.9% |
| 5 | Portland, OR | $83,502 | $1,521 | 21.9% |
| 6 | Arlington, VA | $130,144 | $2,378 | 21.9% |
| 7 | Fort Worth, TX | $68,568 | $1,270 | 22.2% |
| 8 | Phoenix, AZ | $70,283 | $1,303 | 22.2% |
| 9 | Indianapolis, IN | $59,562 | $1,123 | 22.6% |
| 10 | San Antonio, TX | $56,185 | $1,072 | 22.9% |
| 11 | Denver, CO | $85,001 | $1,622 | 22.9% |
| 12 | Columbus, OH | $60,250 | $1,168 | 23.3% |
| 13 | Kansas City, MO | $64,541 | $1,252 | 23.3% |
| 14 | Minneapolis, MN | $71,217 | $1,415 | 23.8% |
| 15 | Sacramento, CA | $77,825 | $1,566 | 24.1% |
| 16 | Charlotte, NC | $72,329 | $1,470 | 24.4% |
| 17 | Las Vegas, NV | $61,425 | $1,281 | 25.0% |
| 18 | Honolulu, HI | $82,847 | $1,735 | 25.1% |
| 19 | San Jose, CA | $130,163 | $2,731 | 25.2% |
| 20 | Houston, TX | $56,401 | $1,184 | 25.2% |
| 21 | Atlanta, GA | $77,337 | $1,630 | 25.3% |
| 22 | Madison, WI | $70,080 | $1,514 | 25.9% |
| 23 | Jacksonville, FL | $60,187 | $1,304 | 26.0% |
| 24 | Saint Louis, MO | $50,989 | $1,148 | 27.0% |
| 25 | Charleston, SC | $80,020 | $1,853 | 27.8% |
| 26 | Washington, DC | $95,873 | $2,258 | 28.3% |
| 27 | Cincinnati, OH | $48,227 | $1,141 | 28.4% |
| 28 | Dallas, TX | $58,908 | $1,403 | 28.6% |
| 29 | Irvine, CA | $121,839 | $2,924 | 28.8% |
| 30 | Pittsburgh, PA | $57,869 | $1,416 | 29.4% |
| 31 | Hoboken, NJ | $154,993 | $3,795 | 29.4% |
| 32 | Long Beach, CA | $74,211 | $1,834 | 29.7% |
| 33 | Nashville, TN | $67,531 | $1,677 | 29.8% |
| 34 | San Diego, CA | $95,644 | $2,391 | 30.0% |
| 35 | Tampa, FL | $65,588 | $1,641 | 30.0% |
| 36 | Milwaukee, WI | $47,042 | $1,208 | 30.8% |
| 37 | San Francisco, CA | $128,655 | $3,351 | 31.3% |
| 38 | Orlando, FL | $59,951 | $1,578 | 31.6% |
| 39 | Richmond, VA | $53,556 | $1,442 | 32.3% |
| 40 | Fort Lauderdale, FL | $78,954 | $2,276 | 34.6% |
| 41 | Los Angeles, CA | $74,048 | $2,183 | 35.4% |
| 42 | Chicago, IL | $69,230 | $2,043 | 35.4% |
| 43 | Philadelphia, PA | $54,633 | $1,778 | 39.1% |
| 44 | Jersey City, NJ | $88,358 | $3,261 | 44.3% |
| 45 | Bronx, NY | $43,702 | $1,633 | 44.8% |
| 46 | Boston, MA | $84,197 | $3,536 | 50.4% |
| 47 | Miami, FL | $52,516 | $2,230 | 51.0% |
| 48 | Brooklyn, NY | $70,259 | $2,994 | 51.1% |
| 49 | Queens, NY | $75,353 | $3,436 | 54.7% |
| 50 | New York, NY | $71,116 | $4,104 | 69.3% |
Source: ApartmentList
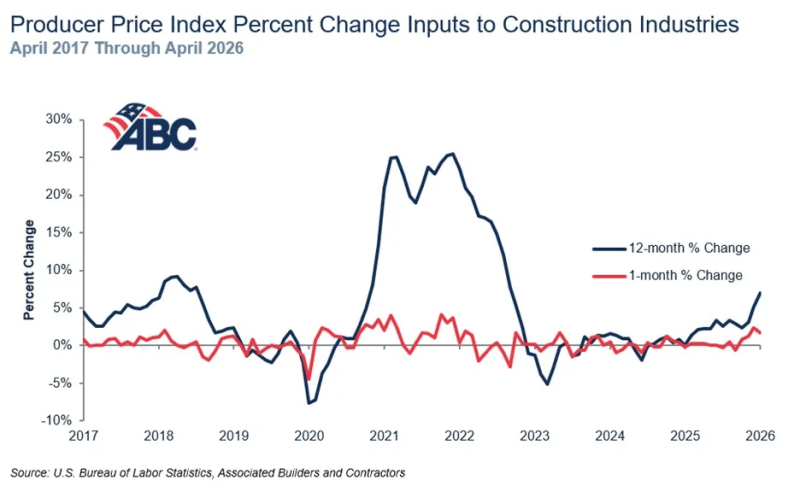
Construction material costs continued climbing in April, extending a sharp escalation that contractors and developers have tracked since the start of 2026.
| Commodity | 1 Month Price Change% | 12 Month Price Change% | Pre-covid Change% |
| Softwood lumber | 5.5 | 0.9 | 26.8 |
| Hardwood lumber | 0.5 | 3.6 | 42.1 |
| General millworks | 0.3 | 2.2 | 35.2 |
| Soft plywood products | 2.5 | (0.1) | 60.6 |
| Hot rolled steel bars, plates and structural shapes | 4.4 | 22.1 | 65.0 |
| Copper wire and cable | (1.3) | 11.8 | 78.0 |
| Builder’s hardware | (0.0) | 8.3 | 38.5 |
| Plumbing fixtures and fittings | 0.0 | 9.0 | 35.0 |
| Furnaces and heaters | 0.2 | 6.2 | 51.5 |
| Sheet metal products | 0.8 | 5.8 | 60.3 |
| Nails | 6.9 | 7.3 | 29.6 |
| Major appliances | (0.1) | 2.3 | 24.3 |
| Flat glass | 1.1 | 5.7 | 41.9 |
| Ready mix concrete | 0.4 | 1.7 | 39.6 |
| Asphalt roofing and siding | 0.3 | 0.7 | 40.8 |
| Gypsum products | 0.2 | (1.0) | 48.6 |
| Mineral wool insulation | (0.6) | (2.3) | 47.8 |
| CPI-U (unadjusted April) | 0.9 | 3.8 | 29.1 |
Source: BisNow
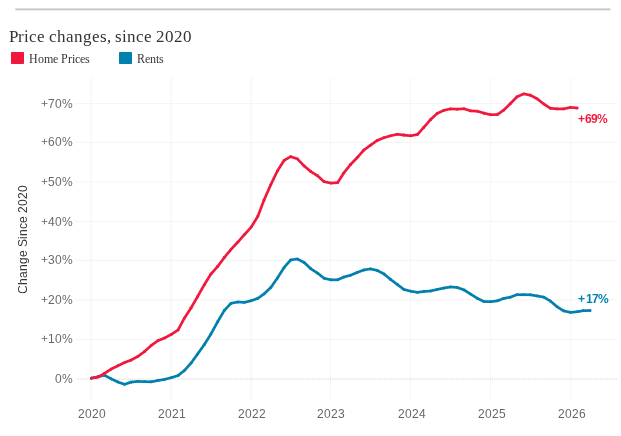
Between January 2020 and January 2026, home prices were up 54% while rents were up only 18%.
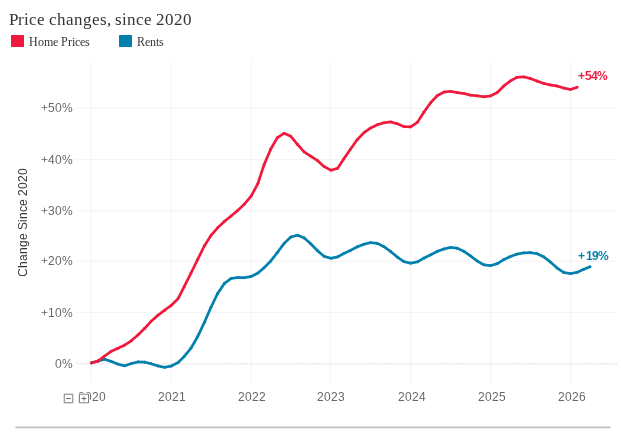
The widest spread between price growth and rent growth is 51 percentage points, in Charlotte NC:
Source: ApartmentList
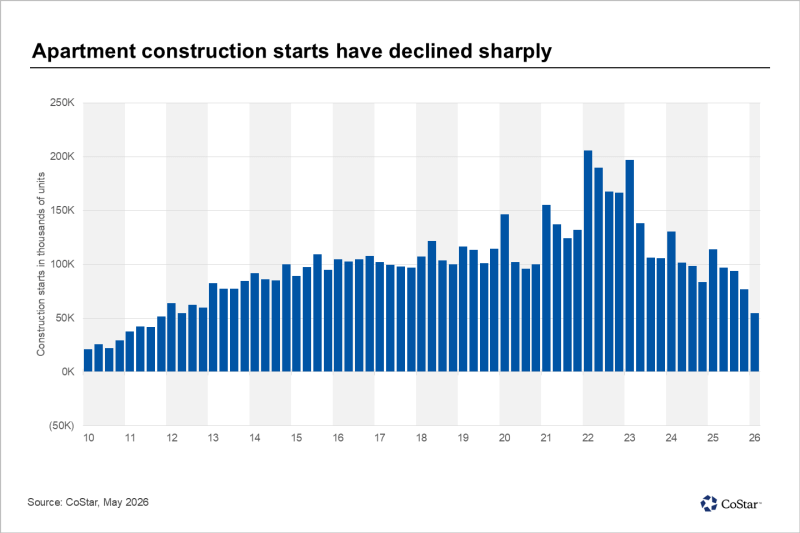
U.S. apartment construction starts declined to approximately 55,000 units nationwide in the first quarter of 2026, a 73% decrease from the peak reached in early 2022 and the lowest quarterly level since 2011.
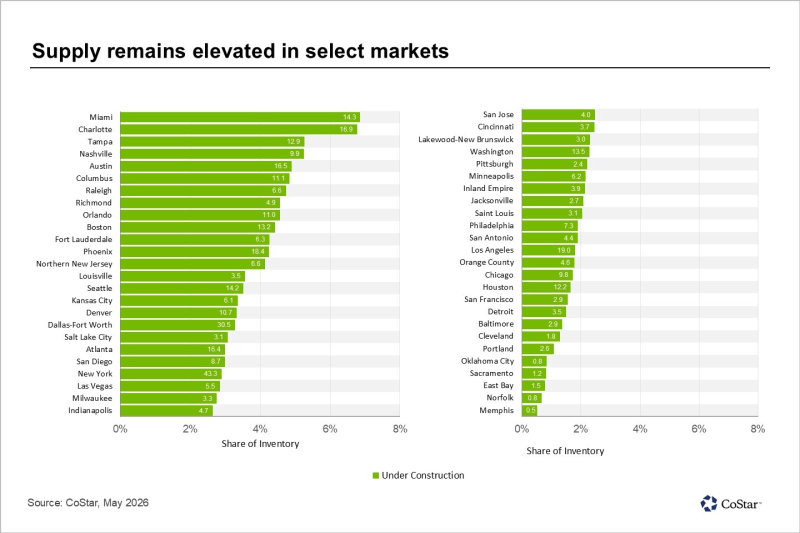
The number of units under construction nationwide declined to roughly 579,000 in the first quarter of 2026, down more than 50% from its peak in early 2023 and broadly in line with mid-2010 levels.
Source: CoStar
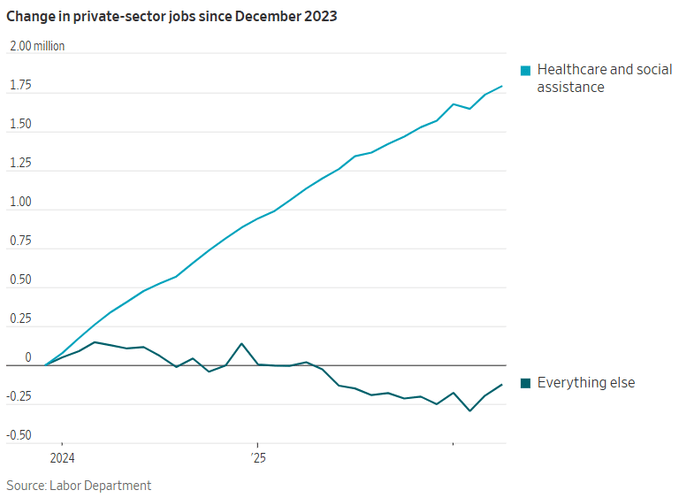
Healthcare and Social Assistance have added nearly 1.8 million private-sector jobs in the US since the end of 2023 while all of other industries combined have lost 127,800 jobs:
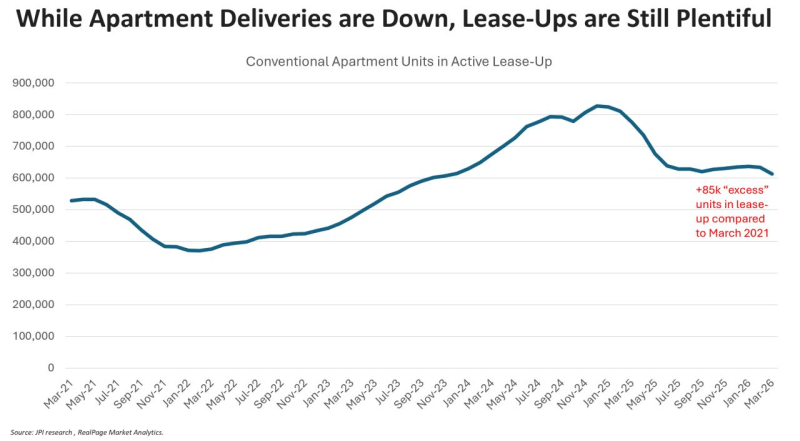
New units that still need to lease-up total 612,000 units nationally. That’s down from the peak of 827,000 units in December 2024, but it’s still about 85,000 units above the baseline from five years ago.
New completions in 2026 are estimated to total about 300,000 units. That’s manageable compared to the 10-year average annual absorption of 350,000 units, but if you add the “excess lease-up” units still to work through, that takes us into 2027 before we catch up … and that’s assuming a normalized absorption rate, which isn’t a given.
Source: Jay Parsons
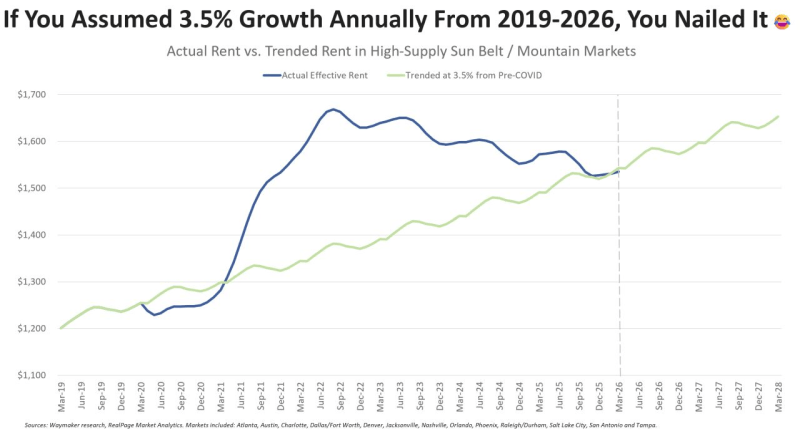
The chart below is a weighted average of the 14 highest-supplied MSAs in the Sun Belt and Mountain markets: Austin, Atlanta, Denver, Phoenix, Raleigh/Durham, Charlotte, Nashville, San Antonio, Dallas, Fort Worth, Tampa, Orlando, Jacksonville, Salt Lake City.
If you bought in a high supply Sun Belt market in 2019 and assumed 3.5% rent growth annually for seven years (light blue line below), you would have been exactly right. That proforma estimate converged with the actual actual path rents took (dark blue line below) this spring.
Source: Jay Parsons
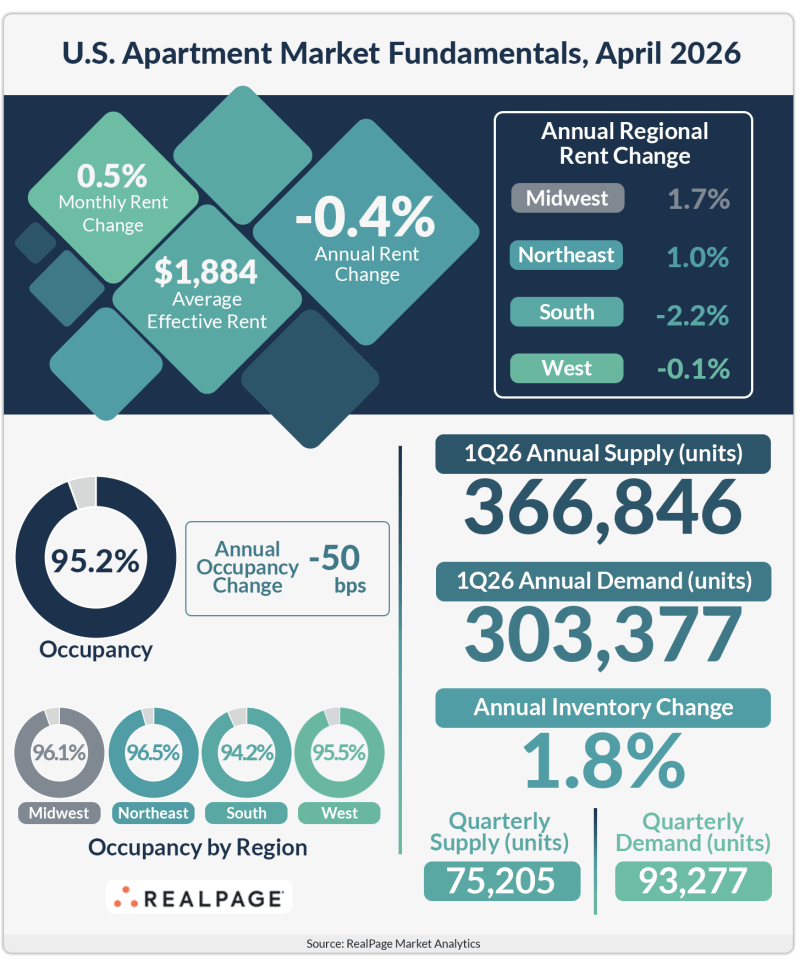
For the first time in seven months, U.S. apartment occupancy rose back above the essentially full mark of 95%.
After steadily declining throughout the back half of 2025, apartment occupancy increased in each of the first four months of 2026. U.S. occupancy hit 95.2% in April, after rising 20 basis points (bps) since March and a total of 60 bps since bottoming out at the end of 2025.
U.S. prices were up 0.5% in April, marking four consecutive monthly increases between 0.2% and 0.5%. That four months of growth, however, couldn’t wipe out previous declines, leaving April rents 0.4% below year-earlier prices.
Source: RealPage