Asheville is scheduled to see 3,549 units deliver in calendar 2025, which marks the highest delivery load in the RealPage Market Analytics data set and translates to the highest annual inventory increase in the nation at 13.3%.
It’s no surprise to see Asheville top this list, as this market has grown at one of the fastest clips nationwide in the past 10 years. Still, even in a decade of elevated supply, the small North Carolina market’s annual delivery volume has averaged below 1,000 units.
The Bull Case: Why Rates Would Move LOWER From Here:
From Jerome Powell (The Fed Chairman)’s press conference and Q&A November 7 after cutting an additional 25 basis points:
“We are on a path towards a more neutral stance and that has not changed at all.”
“We don’t start modeling things like tax cuts until they are closer to becoming law.”
“The labor market has cooled a great deal from two years ago. The labor market continues to cool.”
“Inflation has moved down a great deal from its high two years ago. If you look at Core PCE over 3 and 6 months, it’s just 2.3% We would be concerned if we saw inflation expectations anchoring at a higher level, but that’s not what we’re seeing. We will not allow inflation expectations to drift upward.”
“A couple of data points, good or bad, won’t really change the pattern now that we are this far down in the process.”
He repeatedly said they will be more sensitive to risks/noise after they get closer to neutral.
The Bear Case: Why Rates Would Move HIGHER From Here:
From Jerome Powell (The Fed Chairman)’s statement and Q&A November 7:
“We know the destination but don’t know the pace. “But nothing in the economic data suggests the Committee needs to be in a hurry to get to neutral.”
“As we approach levels that are plausibly neutral, we could slow the pace of cuts.”
Right now, the market is pricing the neutral rate at 2.88% (orange line below). If that’s where the Fed ultimately lands with the Fed Funds rate, then historically the 10-year treasury is about 1.50% above that rate. That would put the 10-year at 4.38%, right about where it is today. If the neutral moves higher (it has been rising since March), then that resets the entire yield curve higher:
The five-year breakeven rate, the difference in yield between nominal and inflation-adjusted five-year treasuries (a gauge of inflation expectations) is up to 2.5% from only 1.8% in September. The 10-year breakeven hit 2% in September but has climbed back up to 2.4%.
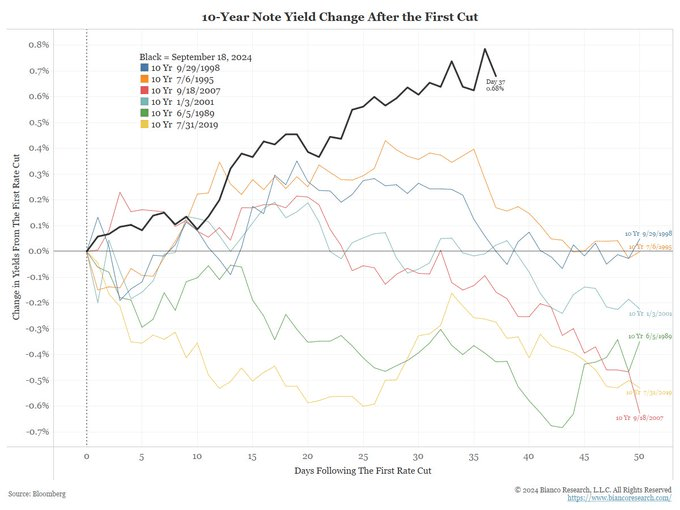
Powell seemed unconcerned at the press conference by the recent rise of the 10-year treasury yield after their first 50 point cut in September (see dark black line in graph below comparing the 10-year rise to how it behaved the last six times the Fed started cutting rates). He doesn’t see a correlation (yet) to the idea that cutting rates while the economy is so strong could perversely create a rise in the long end of the yield curve (rate cuts could reignite inflation, create stronger growth, weaken the currency, etc.).
From Powell: “I — look, I just think — the first question is how long will they be sustained? If you remember the — the 5 percent 10-year, people were drawing massively important conclusions, only to find, you know, three weeks later, that — that it — the 10 year was 50 basis points lower. So, you know, it’s — it (inaudible) — it’s material changes in financial conditions that last, that are persistent that really matter. And we don’t know that about these. What we’ve seen so far, you know, we’re watching it, we’re reading — you know, we’re — we’re doing the decompositions and reading others, but right now, it’s not a major factor in — in how we’re thinking about things.”
The MOVE (the bond market’s VIX – volatility index) has collapsed in the last two days, which is understandable now that the election and Fed meeting have passed. The fact that the MOVE fell, and the 10-year yield moved from 4.28% to 4.35% simultaneously suggests that this yield rise was not a response to higher volatility. Lower volatility may not help yields go down.
The two-year treasury yield, going back decades, has been a good forward indicator of the Fed’s upcoming moves. It is not projecting major easing ahead:
Strong Economic Data:
The most recent GDP report showed the economy growing at 3%
Atlanta Fed’s tracker estimates 2.4% GDP growth this quarter
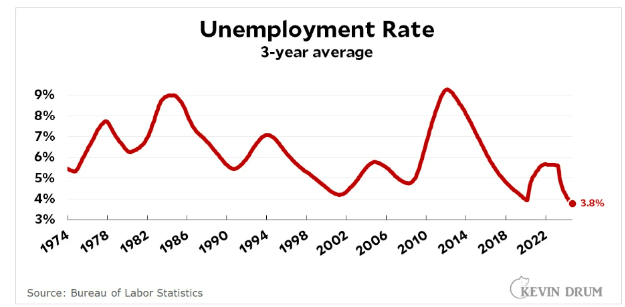
Unemployment is only 4.1%; historically low
Supply:
The nonpartisan Committee for a Responsible Federal Budget estimates Trump’s spending plans could add up to $15 trillion in deficits over the next 10 years
The U.S. budget deficit is the largest among OECD countries (as a percentage of GDP):
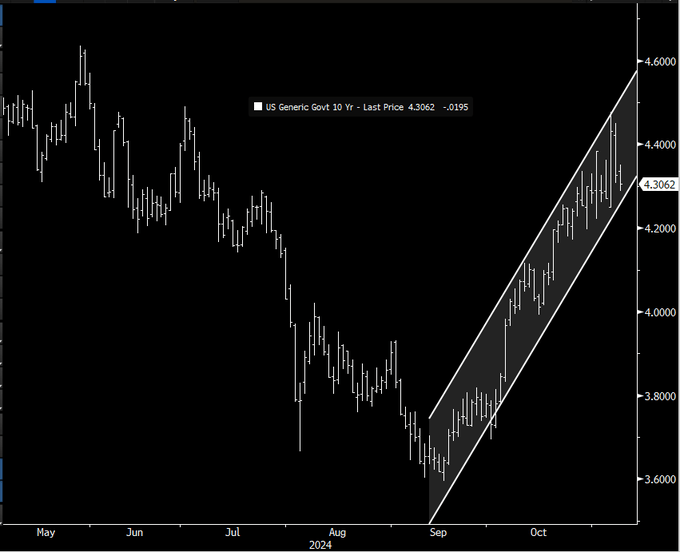
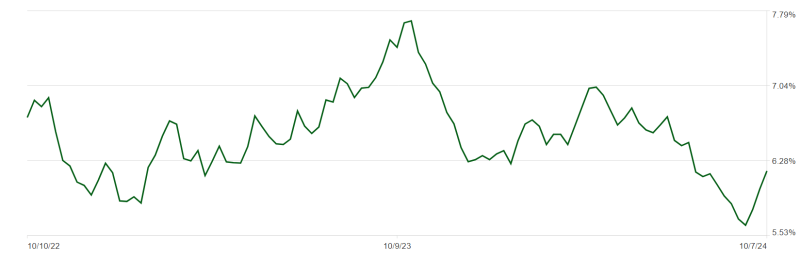
From a technical perspective, the move higher in rates has stayed within a steady channel which bond traders view as an uptrend:
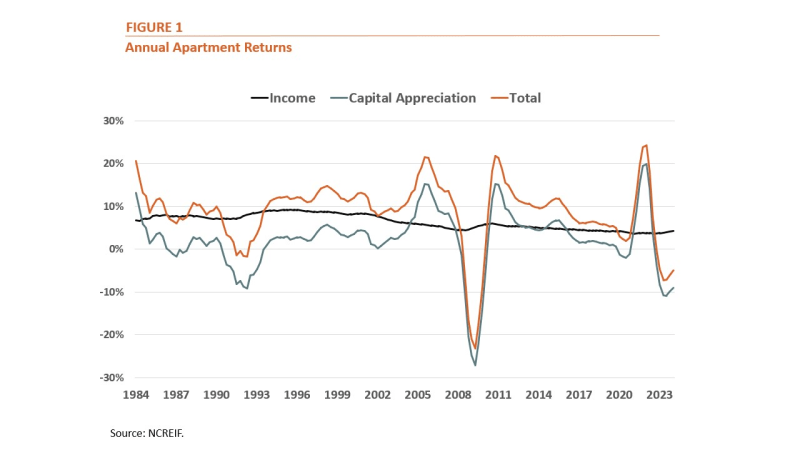
Data from NCREIF shows that total, unlevered returns for apartment investors averaged 8.2% annually over the past 40 years. However, returns have been lower in recent years, averaging 6.0% annually over the last decade and 4.2% over the past five years.
The graph below shows that volatility in apartment returns is driven primarily by changes in the price of apartment properties as opposed to the income that they produce, which has remained relatively constant over time.
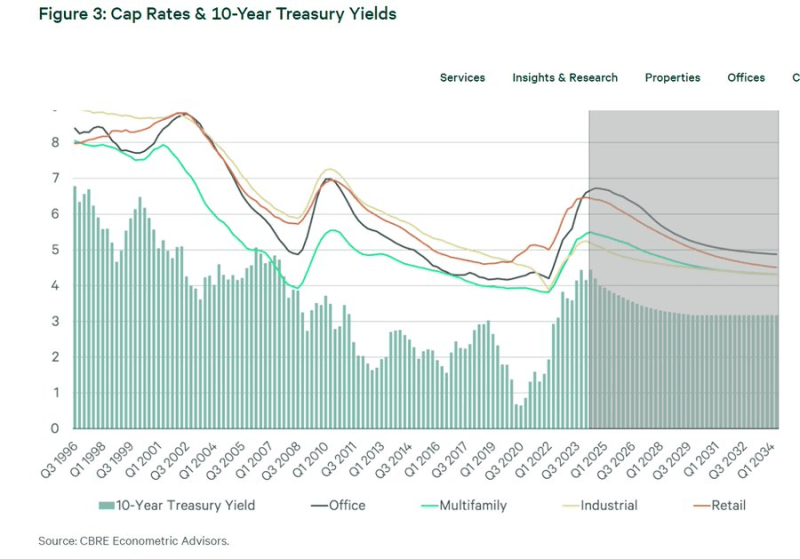
The 28 year relationship between the 10 year treasury yield and cap rates on different commercial real estate sectors. For every 100 basis point move in the 10 year treasury, multifamily cap rates move about 70-80 basis points.
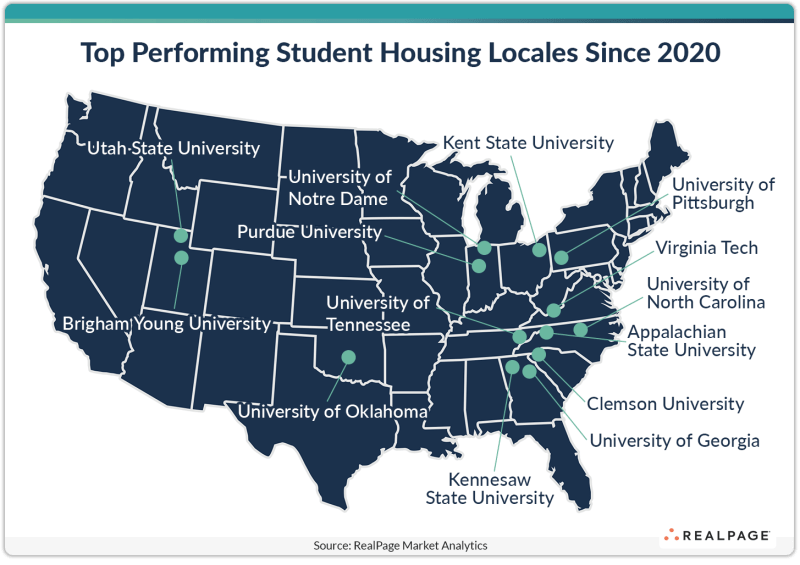
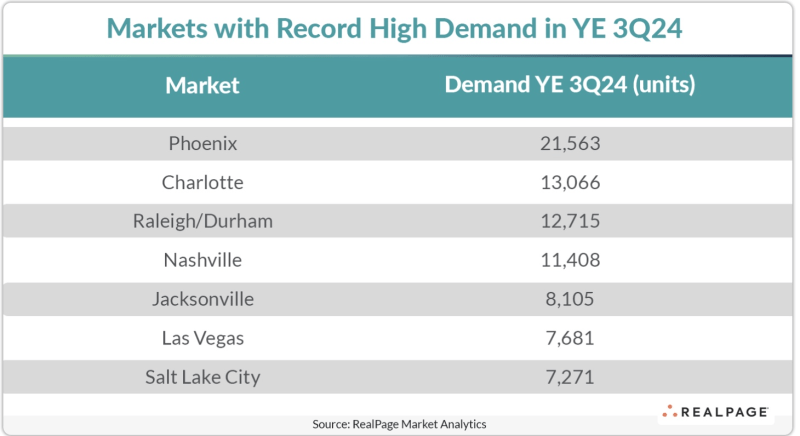
These seven markets have several tailwinds aiding their record demand performances. For one thing, they’re all experiencing favorable demographics to support housing demand. Populations in these seven markets have all grown at rates at least double (and in some cases, triple) the national norm since 2017, according to the U.S. Census Bureau.
Raleigh, Nashville and Jacksonville have all grown total populations over 10% in the five-year period ending in 2022, which is the latest Census data available. Nationwide, population growth during that time was 3.1%.
Job growth tends to run higher and unemployment tends to run lower than national averages in these markets, further supporting housing demand.
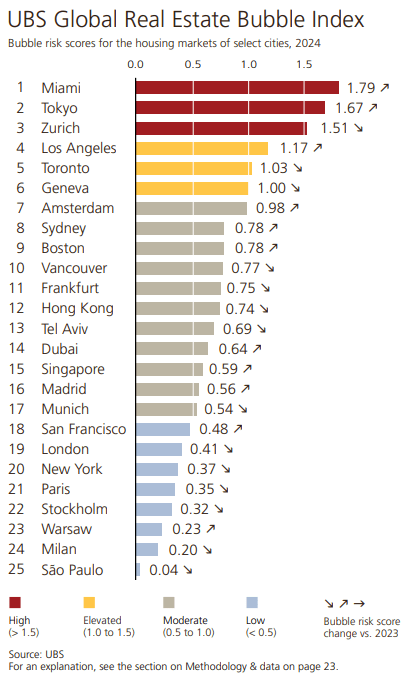
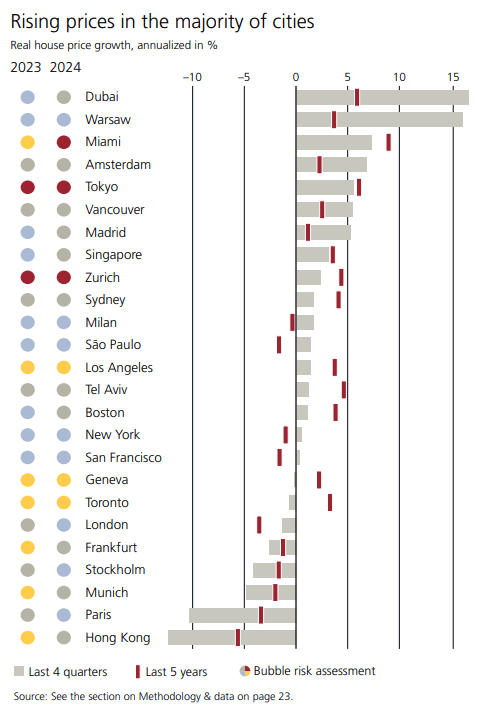
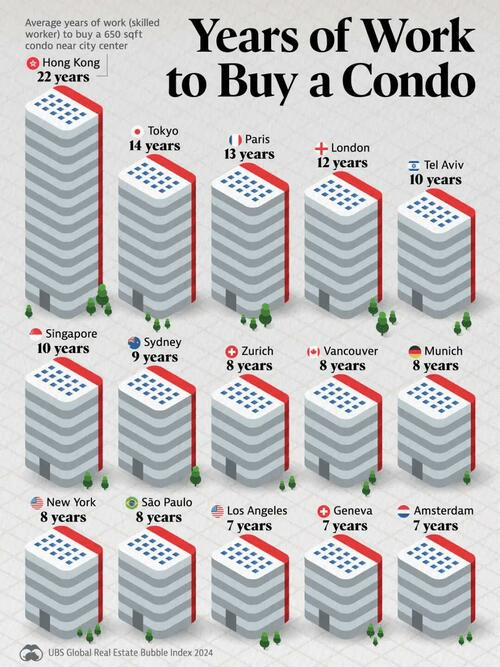
Identifying a bubble: Price bubbles are a recurring phenomenon in property markets. The term “bubble” refers to a substantial and sustained mispricing of an asset, the existence of which cannot be proved unless it bursts. But historical data reveals patterns of property market excesses. Typical signs include a decoupling of prices from local incomes and rents, and imbalances in the real economy, such as excessive lending and construction activity. The UBS Global Real Estate Bubble Index gauges the risk of a property bubble on the basis of such patterns. The index does not predict whether and when a correction will set in. A change in macroeconomic momentum, a shift in investor sentiment, or a major supply increase could trigger a decline in house prices.
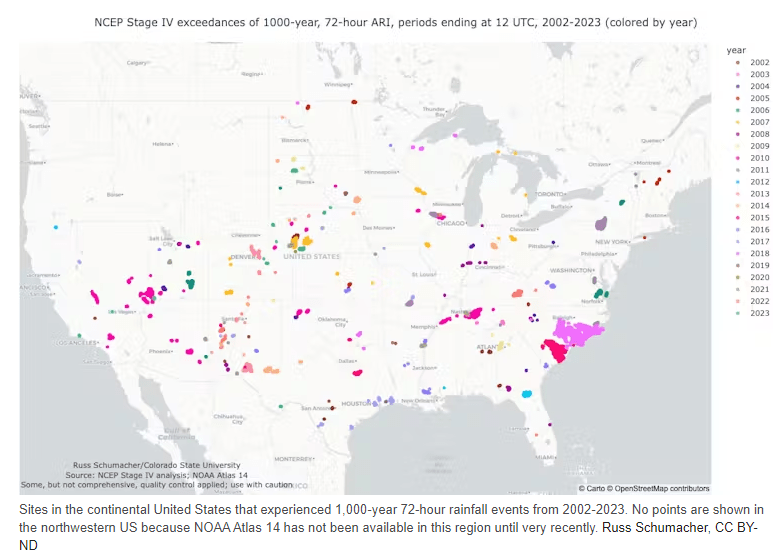
The problem with terms like 100-year event or 1,000-year event is that many people hear them and assume they mean another storm of that size shouldn’t occur for another 99 or 999 years. That’s a reasonable conclusion, but it’s incorrect. Each storm is an individual event, so just because one becomes unusually large doesn’t mean that another storm a year later can’t exceed the odds as well.
Imagine you’re rolling a pair of dice. The odds of throwing a pair of sixes is small – just 1 in 36, or slightly less than 3%. But if you roll the dice again, the odds don’t change – they are the same for that roll as the one before.
A more accurate way to communicate storm odds is to think about the annual exceedance probability – the chance that a rainstorm of a given size could occur in any single year. A 1,000-year storm has a 0.1% chance of occurring in any year, and the same probability of occurring again the next year, and the year after.
Since the U.S. is a big country, we should expect to see a bunch of 0.1% probability rainstorms every year. The chance of such a storm occurring at any specific location is extremely low, but the chance of one occurring somewhere becomes quite a bit higher.
Put another way, even if you are unlikely to experience a 1,000-year storm at your location, there likely will be 1,000-year storms somewhere in the country every year.
Why have so many storms that, historically and statistically, should be exceedingly rare, struck the Carolinas in just a few years? There are two main reasons, which are related.
First, estimating the probability of rare events requires increasingly large amounts of data. NOAA’s Atlas 14 was last updated for the Carolinas in 2006, and those calculations only used data through 2000.
As more storms occur and more data is collected, the estimates get more robust. Given that reliable rainfall measurements only extend back about 100 years, the true probability of this much rain in the Carolinas may have been underestimated up until now.
Second, these statistics assume the climate isn’t changing, but we know that it is. Especially in regions near the coasts, the frequency of heavy rainfall has increased as a result of human-caused climate change. Warmer air can hold more moisture, and warmer oceans provide that moisture as the fuel for heavy rainfall.
As a result, climate change is making rainstorms that had been extremely rare now somewhat more likely. While the Carolinas may have been especially unlucky in recent years, the dice are also becoming loaded toward heavier rain – a trend that poses major challenges for emergency preparedness and recovery.