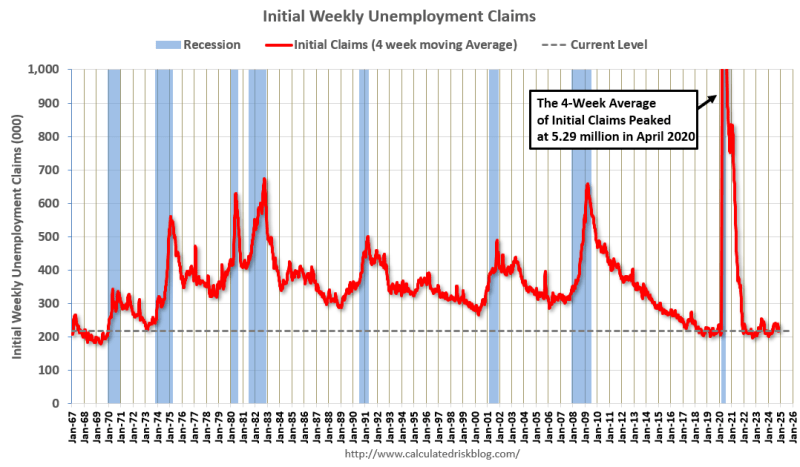
What It Is: Show how many people filed for unemployment benefits during the past week
Claims jumped from 225,000 last week to 242,000 this week, much higher than expected
What It Means: A weaker jobs market could make the Fed more aggressive cutting rates in the months ahead
This Week’s Pensford Letter (12/9/24): If This Month’s Employment Report Focused On The Unemployment Rate, Instead Of The Headline Payrolls Number, Here Is How It Would Read:
The labor market deterioration accelerated in November as the economy shed another 355k jobs.
The unemployment rate ticked up to 4.2% but benefitted from rounding down. The true print was 4.246%, which gets reported as 4.2%. Had just 6,700 more people reported being unemployed, the headline UR would have been 4.3%. It was 3.3% a year ago.
Over 7.1 million Americans are now unemployed, an increase of nearly one million from last year. The number of workers settling for part-time jobs due to weak economic conditions has ballooned to 4.5 million, up from 4.0 million last year.
Long-term unemployment, a key indicator of structural labor market problems, is up 41% over the past year. 1.7 million workers have now been jobless for over 6 months, up from 1.2 million a year ago.
The employment-population ratio continues its worrying decline, dropping to just 59.8%. More Americans are simply giving up looking for work, with labor force participation falling to 62.5% – extending a concerning downward trend that began last December.
The unemployment to employment ratio, which measures the % of unemployed that became employed last month. Excluding covid, it’s at its lowest level in 10 years.
The overall hiring rate fell to 3.3%, lowest since June and comparable to 2013 levels.
Job openings are still down 36.4% from March 2022 peak.
Full-time jobs fell 111k, part-time down 268k.
Multiple job holders increased by 275k.
Permanent layoffs are trending higher, now above 1% of labor force.
Average monthly job revisions of -36k since December 2022, a level rarely seen outside recessions.
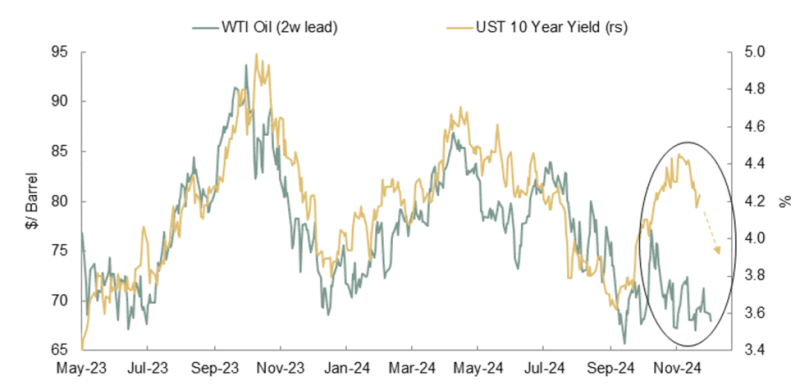
This is why the market’s odds of a Fed rate cut rose to 86% after the jobs report. But what about the 10 Year Treasury? Given the high correlation between oil and rates, it looks ready to fall below 4% in the weeks ahead:
_______________________________________
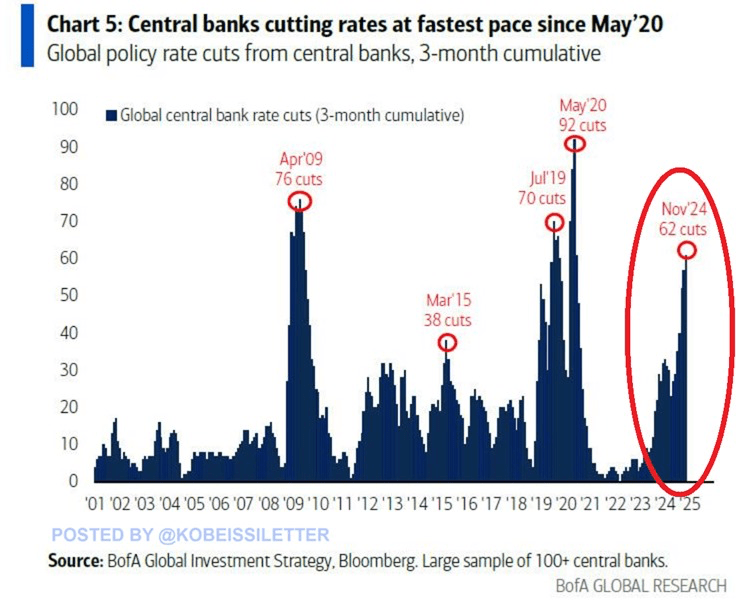
Global central banks have conducted 62 rate cuts over the last 3 months, the most since the 2020 pandemic. This is the 4th fastest pace of rate cuts this century. To put this into perspective, during the peak of the Financial Crisis in 2009, global central banks implemented 76 rate reductions.
What it means: If rates are falling around the world it makes United States yields, included multifamily cap rates, more attractive to global investors.
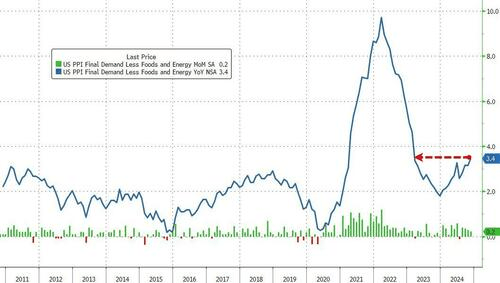
What It Is: Measures the change in prices for goods and services before they reach consumers
Up 0.4% month-over-month, on expectations of 0.2%, the highest increase since June
The year-over-year rate came in at 3.0%, far above expectations, and the highest since February 2023
Core PPI (excludes food and energy) jumped to 3.4% year-over-year, much higher than expected and the highest since February 2023
What It Means: A much hotter than expected inflation number pushes the Fed further away from their 2.0% inflation target and may reduce the number of times they cut rates over the coming year
What It Is: Measures the average change in prices that consumers pay for goods and services over the past month.
Inflation rose 0.3% month-over-month bringing the annual rate up to 2.7%, the highest reading since July and trending in the wrong direction
Core CPI (excludes food and energy) also rose 0.3%, higher than the expected 0.2%, bringing the annual rate up to 3.3%
What It Means: Inflation remains sticky and has been moving further away from the Fed’s 2.0% target for months. This may reduce the number of times the Fed cuts interest rates over the coming year.
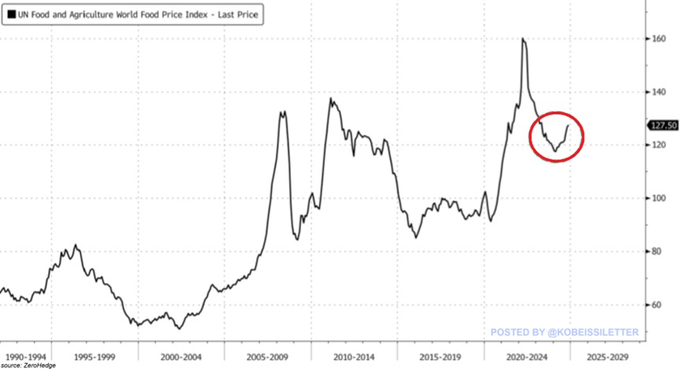
One of the more worrisome categories in the inflation reports has been food prices, which are back on the rise. The UN Food and Agriculture World Food Price Index has been now rising for 5 straight months. Since the beginning of 2020, global food prices are up 26.5%.
What it is: A monthly report that gives an estimate of how many new jobs were created in the U.S. private sector. It’s published by a company called ADP, which processes payrolls for many businesses.
146,000 new private jobs were created in the private sector last month, below the expectations of 166,000.
The previous month was also revised down to 188,000.
What it means: A weaker than expected report makes the Fed more likely to cut interest rates
Despite adding 5.8 million housing units over approximately four years (since our previous estimate), housing demand has increased by almost the same amount, resulting in very little progress in reducing the housing shortage.
In the aggregate, we estimate that U.S. housing stock is 3.7 million units below what is needed given our current population and assuming inflation-adjusted housing costs returned to historical levels.
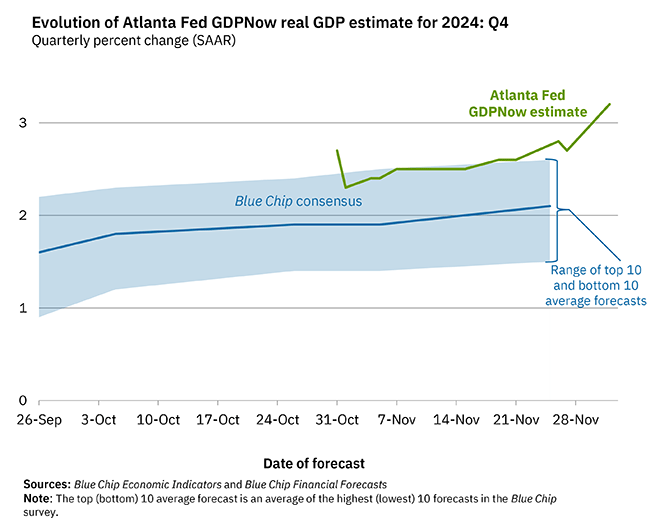
What it is: “The growth rate of real gross domestic product (GDP) is a key indicator of economic activity, but the official estimate is released with a delay. Our GDPNow forecasting model provides a “nowcast” of the official estimate prior to its release by estimating GDP growth using a methodology similar to the one used by the U.S. Bureau of Economic Analysis.”
The GDPNow model estimate for real GDP growth (seasonally adjusted annual rate) in the fourth quarter of 2024 is 3.2% on Dec 2, up from 2.7% on Nov 27.
What it means: If GDP growth is accelerating, it will make the Fed less likely to cut interest rates
Powell again emphasized that there’s little urgency for the Fed to lower interest rates quickly, given the uncertainty in the inflation outlook and a solid current economic backdrop.
“The economy is strong, and it’s stronger than we thought it was going to be in September,” Powell said. “The downside risks appear to be less in the labor market, growth is definitely stronger than we thought, and inflation is coming a little higher. So the good news is that we can afford to be a little more cautious as we try to find neutral.”
What it means: The strength in the labor market and sticky inflation may slow the Fed down with interest rate cuts in the months ahead
What it is: A report that gives a snapshot of the U.S. economy. It’s like a collection of stories and observations from different regions of the country about how businesses are doing.
Though growth in economic activity was generally small, expectations for growth rose moderately across most geographies and sectors.
The Fed’s districts reported that inflation was rising only modestly, and companies had more trouble passing on higher costs as consumers grew more discerning about pricing.
Hiring was seen as subdued with low worker turnover, while layoffs were also limited. Business contacts said they expected steady to modest growth in employment.
What it means: Relative to recent months that had a more negative tone (which Jerome Powell commented on after their first 50 basis point cut), this report reflects stronger growth and makes the Fed less likely to cut interest rates.
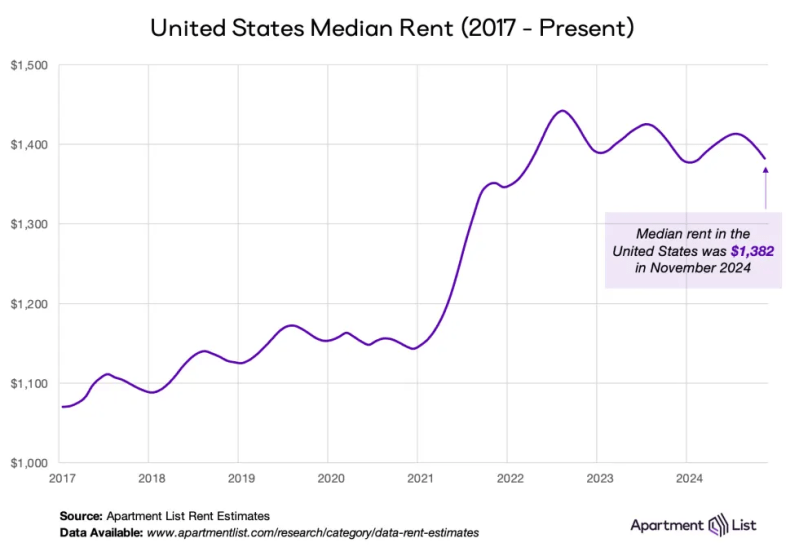
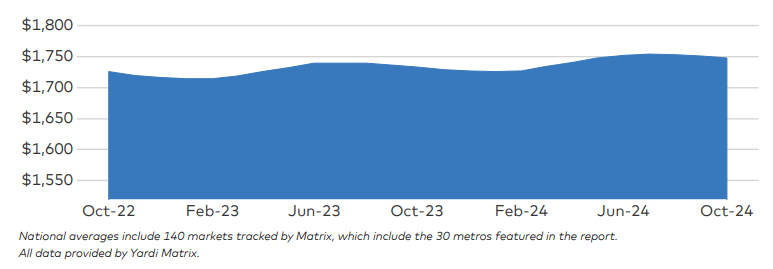
The national median rent dipped by 0.8% in November, as we get further into the slow season for the rental market. Nationwide rent fell $12 to $1,382, and we’re likely to see that number dip one more time before the year ends.
Since the second half of 2022, the seasonal declines in rent prices that take place during the fall and winter have been steeper than usual and seasonal increases of the spring and summer have been milder. As a result, apartments are on average slightly cheaper today than they were one year ago. Year-over-year rent growth nationally currently stands at -0.6 percent and has now been in negative territory for nearly a year and a half.
On the supply side of the rental market, our national vacancy index continues trending up slowly and sits at 6.8 percent, the highest reading since the onset of the pandemic.
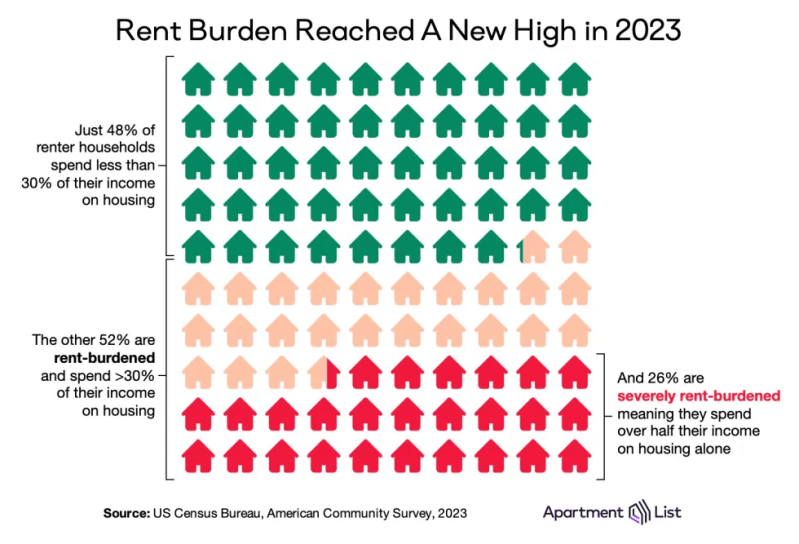
Broadly accepted financial wisdom dictates that a household should spend no more than 30 percent of its gross monthly income on housing costs.
More than half spend above that level, qualifying them as “cost-burdened.”
More than one-in-four renter households spend over 50 percent of their income on rent, making them “severely cost-burdened.”
The cost burden rate could even be underestimating the degree to which housing affordability has worsened. A lack of affordability has deterred new household formation in recent years, as Americans are increasingly doubling up with family or roommates to save on housing costs. These individuals are struggling with housing affordability, but because they don’t represent their own households, they are not captured in cost burden statistics.
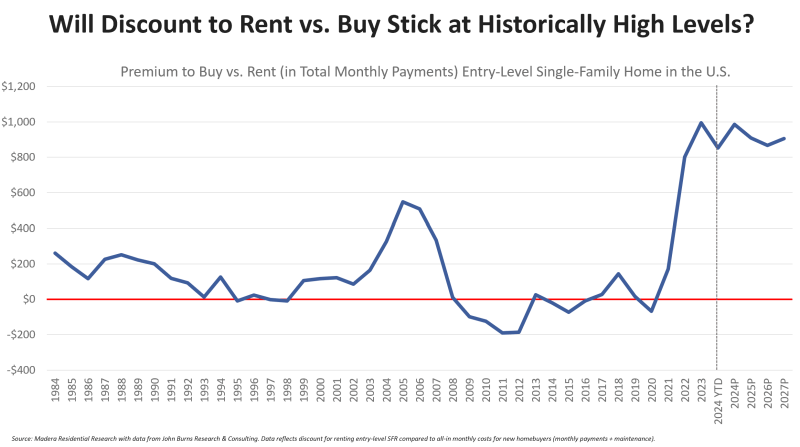
Additionally, as the affordability of for-sale housing has eroded even more rapidly than that of rentals, more prospective homebuyers are continuing to rent. This subset of renters who have been sidelined from the for-sale market tend to be higher-income, and their presence in the denominator of the renter cost-burden rate could be depressing that rate slightly.
Texas and the Carolinas are really going to test the depth of demand in the coming few quarters when their supply peaks in the first half of 2025. There may be a slower return to normal revenue growth levels due to sheer volume, and supply’s impact is cumulative over a multiple-year period.
Apartments have been a top investment target for many years, but tighter margins combined with economic headwinds have led to more investor jeopardy, especially for value-add multifamily product. There are some signals that suggest a wave of distress is incoming.
“I believe the canary in the coalmine is property liens,” says Kidder Mathews SVP Nathan Thinnes. “Vendors are usually the first to not get paid, and we’re seeing a big uptick in accrued liens, specifically in the multifamily space.”
“Any hopes borrowers have of a lower cap rate environment to aide in their workout solution is quickly fading.”
Visualizing the decline in property values based on a rise in cap rates and assuming NOI stays equal. This, of course, works in the opposite direction if cap rates fall (property values rise).
In this example using a $1,000,000 NOI, a class B property that traded at $22.2 MM (4.50% cap rate) at the market peak in 2022, would trade at $17.3 MM today using a 5.75% cap rate and the same NOI (the blue line scenario below):
When the Fed Funds interest rate is higher than the inflation rate, we have positive real interest rates. That, in turn, applies the brakes on the economy. With Fed Funds at 4.5% – 4.7% and Core PCE at 2.7%, we have positive real rates of 2%, aka braking action.
This is why Powell continues to stress that rates are restrictive. CPI has fallen from 9.1% to 2.6%. Monthly job gains have dropped from 550k to 150k.
The neutral rate is a hypothetical rate where the Fed is neither encouraging or discouraging growth, then you add inflation.
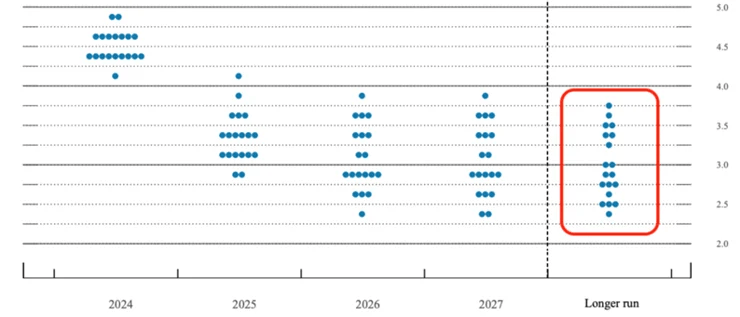
Every other meeting the Fed provides forward guidance through the blue dots seen below. It’s where they think the Fed Funds rate will be at that point in time.
When you read a headline that the Fed’s expectation for long term neutral is 2.8%, it’s really the median blue dot of these projections. Here’s September’s projections:
If the 3.75% dot is accurate, we are just 0.75% away from neutral. If the 2.25% dot is accurate, we are still 2.25% away from neutral. The range is 2.3% – 3.75%. That’s a huge range, which signals uncertainty and a widening difference of opinions.
But every single one of them is below the current level of 4.5% – 4.75%, which is why it’s reasonable to conclude they will keep cutting. It’s also why Chicago Fed President Austan Goolsbee said, “I still think we’re far from what anybody thinks is neutral. We still got a ways to come down.”
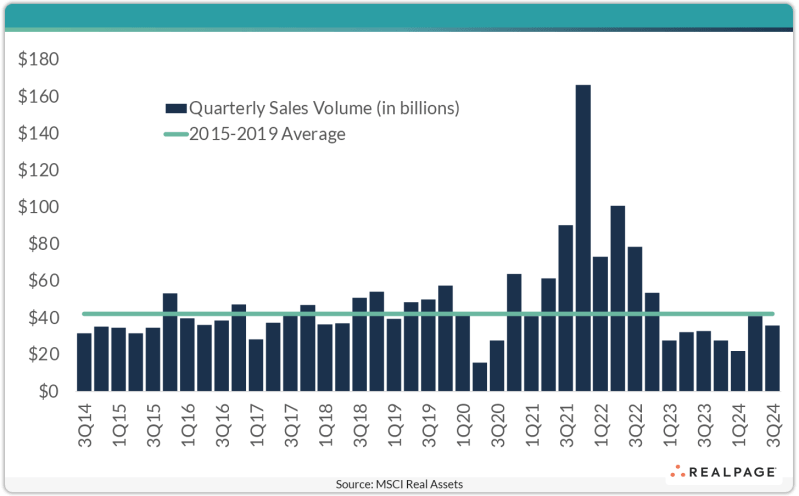
For the second consecutive quarter, the multifamily market has posted year-over-year sales gains. The number of properties traded has settled, indicating that the market is finding an equilibrium.
Volume over the past two quarters is in line with quarterly averages from 2015-2017. While it doesn’t match the levels seen during the booming days of 2021 and 2022, it still reflects a time of healthy market activity and liquidity. Given the sector’s continued tailwinds, multifamily looks to remain the most traded asset class for the foreseeable future.
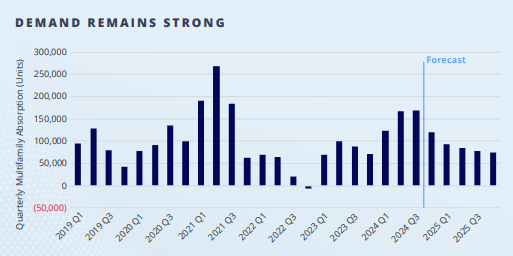
Market fundamentals are nearing an inflection point. New deliveries, which are at multi-decade highs, have been met with near-record demand. Occupancies have slipped, but not to the extent expected given the supply-side pressure.
As this construction cycle abates, and limited groundbreakings follow, occupancies are projected to improve, supporting future rent growth in the quarters, and years ahead. This trend should bring additional capital off the sidelines as investors gain confidence in a near-term market rebound.
The Fed’s preferred measure of inflation (Core PCE) moved up to an annualized rate of 2.8% this month, the highest reading since April (Data released 11/27/24):
The Fed’s inflation target is 2.0%, so if inflation data remains sticky in this range or continues to move higher, it will make it more difficult to continue cutting rates unless unemployment begins to rise to worrisome levels
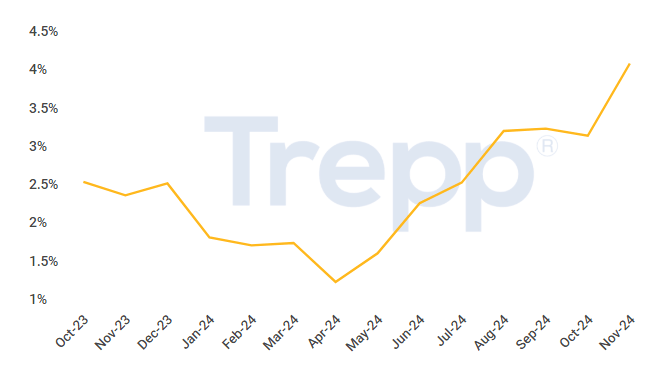
Trepp data reveals there are currently more than 5,800 multifamily loans representing $96 billion with a DSCR below one.
79% of these loans comprise of floating-rate debt with a weighted average interest rate of 7.8% today.
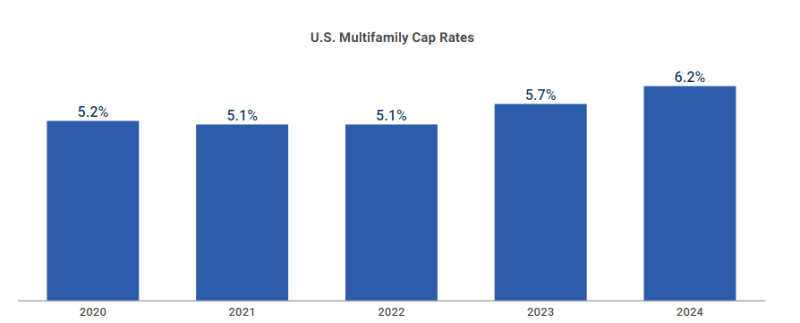
The estimated cap at securitization for multifamily properties has been in the 5.2% to 5.7% range in recent years.
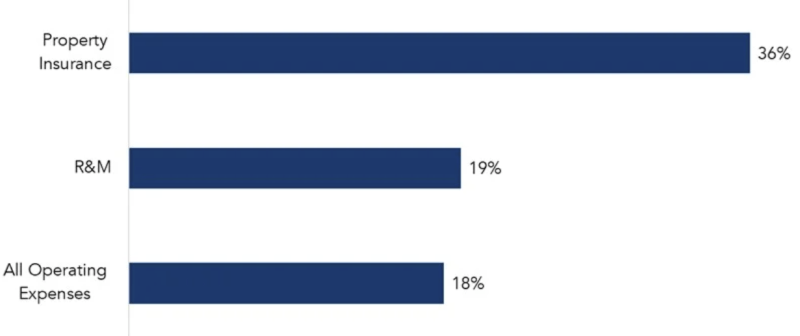
In addition to higher borrowing costs, multifamily owners have been dealing with rising operating expenses in the form of higher property taxes, insurance, repairs and maintenance, and increased labor costs.
Rental rate growth has remained largely lackluster as the market digests the current supply wave.
The year 2023 set records as the warmest on record, accompanied by 28 separate billion-dollar weather and climate disasters. These events caused $92.9 billion in damages nationwide.
More frequent and severe natural disasters and the increasing development of high-value properties in areas prone to hazards have put increased pressure on the insurance industry.
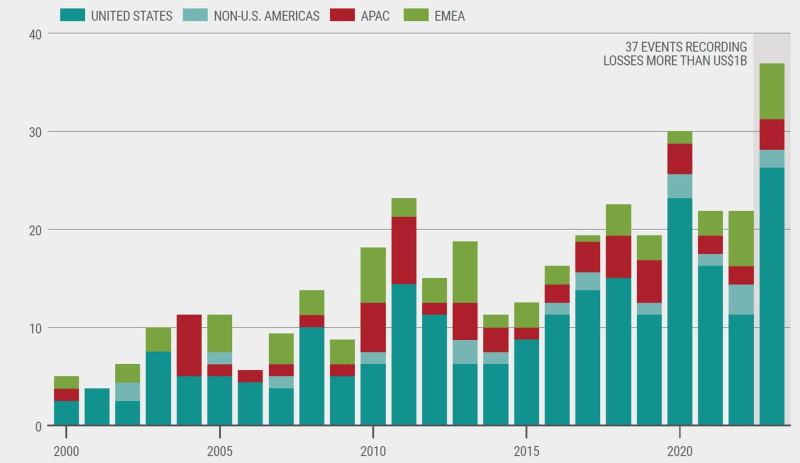
In 2022, U.S. losses accounted for 75% of total global insured losses.
Swiss Re, a leading reinsurer (insurance company that insures insurance companies), anticipates insured losses could double in the next decade due to extreme weather events
Rising Claims Costs, Litigation Pressures, and Construction Cost Inflation
Litigation costs from plaintiffs pursuing substantial compensation for injuries or additional payments for disputed property damage have steadily increased by an average of 2 percent annually since 2015. These claims have added to increased insurance costs, which get passed down to the consumer.
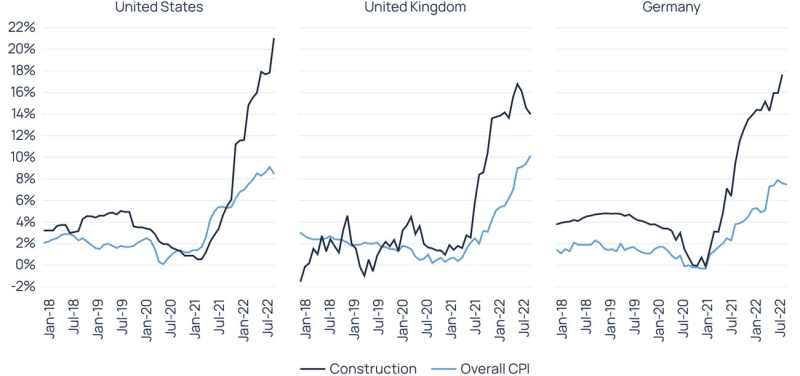
Inflationary pressures on material and labor costs have increased the price to rebuild damaged properties, further escalating claims costs.
Dramatic Cost Increases
For residential apartments, insurance costs as a percentage of total expenses rose from 4% to 7% in 2024, according to the National Council of Real Estate Investment Fiduciaries (NCREIF) Property Index, but some areas are seeing even worse increases.
Strained Operating Margins
Operating expenses for commercial real estate increased by more than one-third from 2017 to 2022, with insurance costs rising by 73% during this period.
Reduced rental demand: Slowing immigration could lower the number of renters entering the market, decreasing occupancy rates and cooling some of the strength we’ve seen in absorptions during recent quarters, which also coincided with record levels of immigration.
By our estimates, from 2022–2024, immigration was responsible for all of the 1.0 million net growth in renter households.
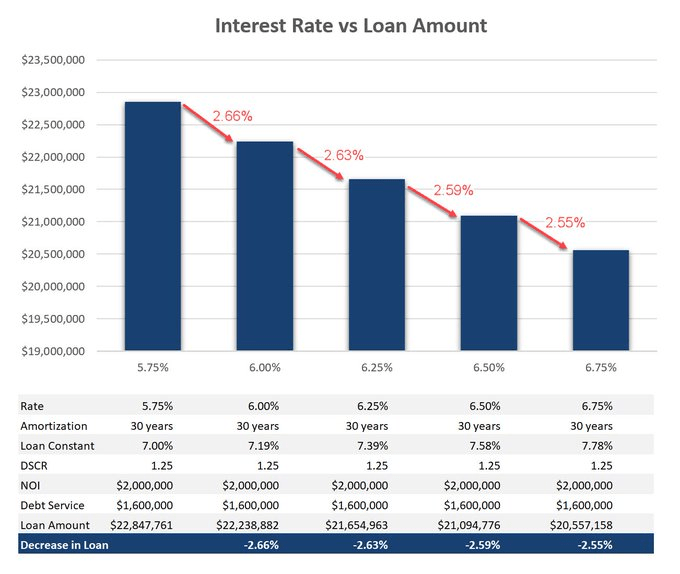
For every 25-basis point increase in interest rates, loan proceeds decrease by approximately 2.6%
If rates have gone up 50 basis points since you last updated your model, then your loan amount will be ~5.2% lower
The example in the chart below uses a $2MM NOI, but the same relationship exists regardless of NOI
Loan Constant = Your annual debt service divided by the loan amount. It takes into account the amortization, so if a loan is interest-only, then your interest rate and your loan constant are the same.
DSCR = Debt Service Coverage Ratio. This is your NOI divided by debt service. Most lenders typically want the NOI to be at least 1.25x the annual debt service.
The 10-year treasury yield has risen 70 basis points since mid-September, which reduces loan proceeds and estimated IRR returns
If you’re scared of US fiscal health, pick another country’s 10-year bond yield to invest in instead of the United States’ 10-year which is currently at 4.45%:
Germany – 2.35%
Australia – 4.45%
Japan – 1.05%
UK – 4.47%
Canada – 3.28%
France – 3.08%
Spain – 3.05%
China – 2.06%
Italy – 3.55%
Greece -3.18%
Not a single developed nation has higher yields than the US. Shouldn’t that help keep a lid on US rates?
“But deficits!” A very solid point. Thankfully, we have precedence when markets get nervous about US fiscal health. What happened when the US lost its AAA rating in 2011? The 10-year yield fell from 3.0% down to 1.8%.
We’re at 120% of debt to GDP – not good. But we crossed that threshold in 2015, and rates didn’t spike. Inflation didn’t take off. The world didn’t end. Japan crossed 100% debt to GDP in 2000. They currently sit > 200%. Did their rates spike? No, it was gigantic news when their interest rates finally turned positive last year. Their 10-year is 1.05% currently.
Fannie Mae and Freddie Mac will each be provided with $73 billion in lending capital for multifamily properties in 2025 – a combined total of $140 billion.
At least 50% of the capital must be put toward mission-driven affordable workforce housing and they have no limits on how much they lend on those properties
The caps are up from $70 billion each in 2024, although Fannie Mae’s volume is only at $38.5 billion so far this year
This means the GSE’s have plenty of ammunition to lend and will continue to provide liquidity to the multifamily debt market
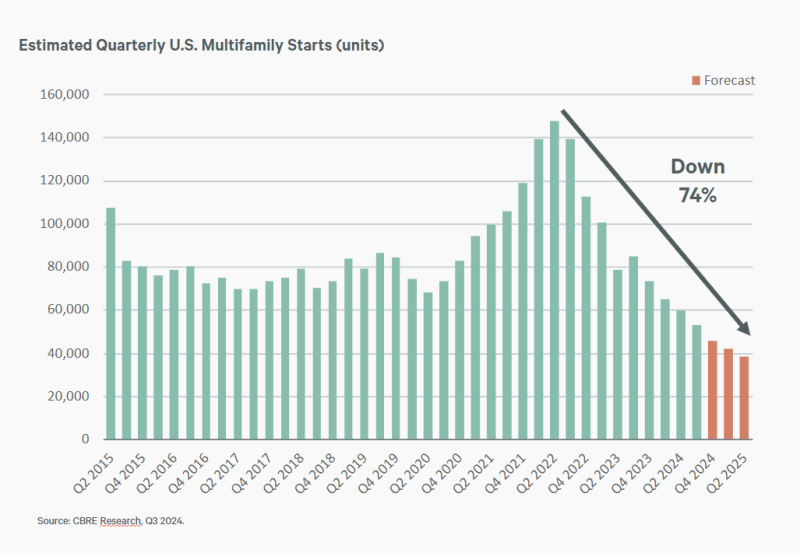
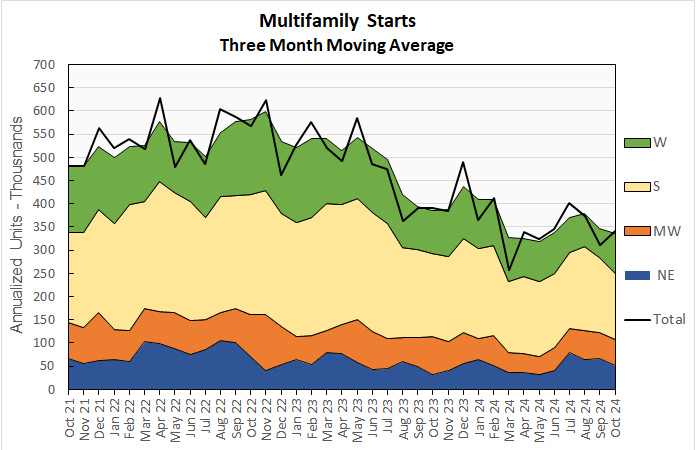
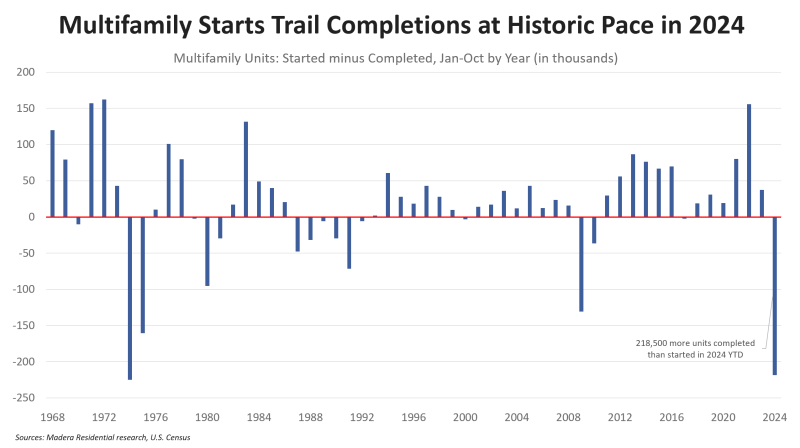
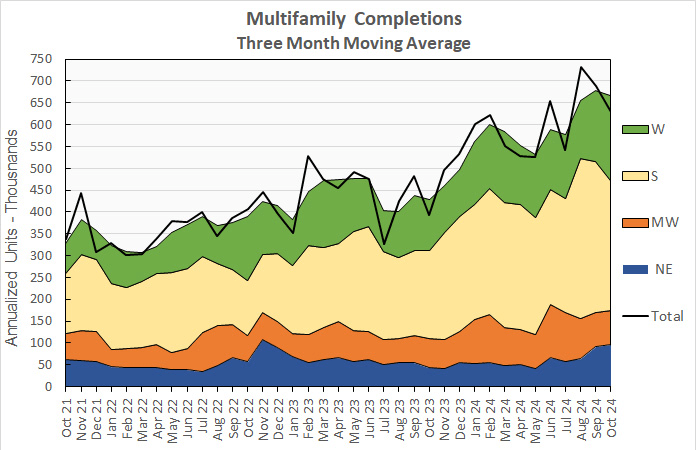
Multifamily starts for October came in lower than any October in the last 12 years. Year-to-date, completions are outpacing starts by 218,500 units. This is a massive deficit that will significantly reduce apartment supply in 2026. Source: Jay Parsons (11/19/24)
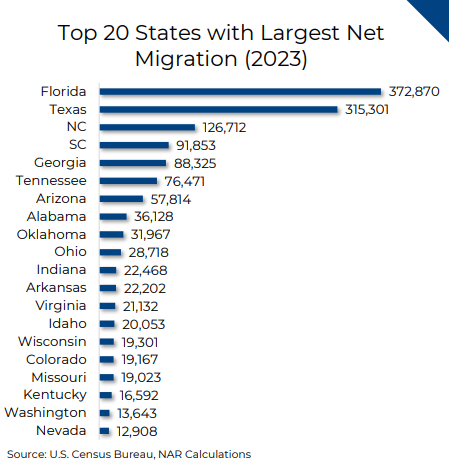
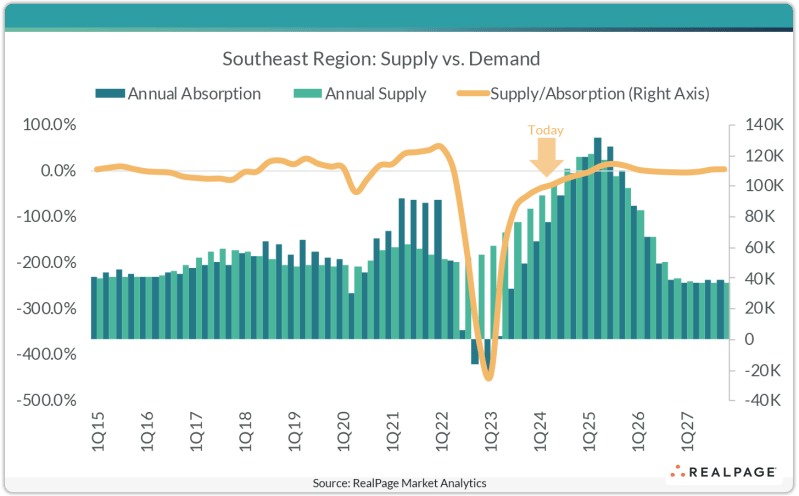
Apartment demand has been significant in the Southeast and is catching up to record supply levels. The Southeast region of the country, which covers markets across Florida, Georgia, Alabama, South Carolina and North Carolina, has seen sizable supply volumes recently. Roughly 111,200 units delivered in this region in the year-ending 3rd quarter 2024. Atlanta was the region leader with over 25,000 units coming online in the past year.
Meanwhile, apartment demand across the Southeast has been catching up as the region absorbed more than 93,600 units in that same time frame. Again, Atlanta was the region’s leader for demand, with 20,100 units absorbed in the past year. While demand is still about 17% behind concurrent supply volumes in the Southeast, that marked a significant improvement from the 80% delta from one year earlier. In the near-term outlook, demand is expected to get even closer to supply, closing the gap even further.
The rate at which workers quit their jobs in September was 1.9% — the lowest since June 2020 and, outside of Covid, a level last seen in 2015.
The number of job openings in September was 7.4 million — a decline of 1.9 million from the previous year.
An increasing share of those who do job hop are settling for lower paychecks. Some 17% of job switchers this year took a pay cut.
Employers are sitting tight,says Daniel Zhao, lead economist at job site Glassdoor. Companies aren’t making big changes to hiring strategy. That means “fewer opportunities for workers to climb the career ladder.” They’re still plugging away at the same role they’ve had for years without the opportunity to move up internally or at a new company.
65% of the 3,400 professionals surveyed by Glassdoor last month said they feel stuck in their current role.
A weaker jobs market would increase the Fed’s speed and quantity of rate cuts
With permits, starts, and housing units under construction all down from their peaks, at levels at least close to consistent with an oncoming recession, the big item to look for is employment in residential construction, and construction generally.
If manufacturing employment remains negative, and construction employment turns down, that would strongly indicate that more likely than not a recession is approaching.
A weaker jobs market would increase the Fed’s speed and quantity of rate cuts
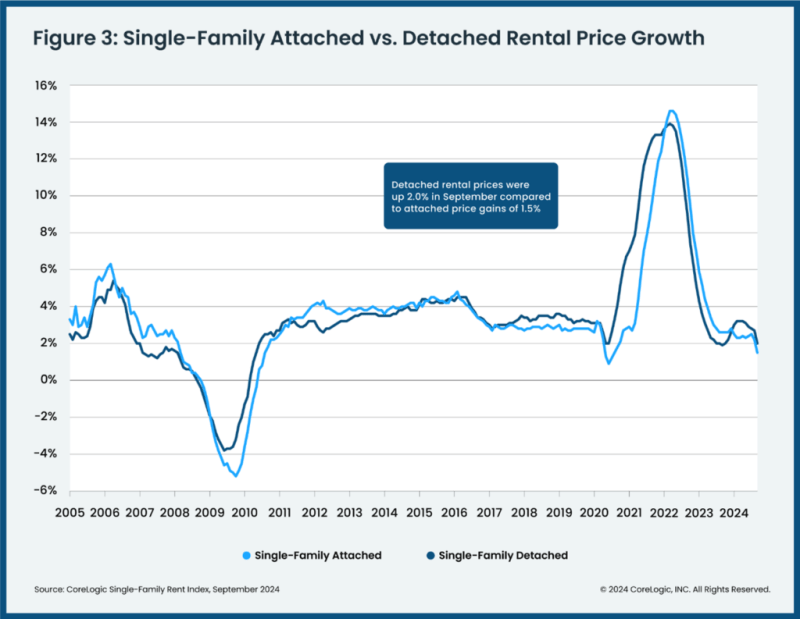
Annual U.S. single-family rent growth registered a 2% increase, continuing a slowing trend that began in early 2024
Single-family rents are a large component of the CPI (inflation index). It tracks on a lag, so if rents continue to cool for single-family homes, it will continue to lower monthly inflation readings in the months ahead (allowing the Fed more room to cut rates)
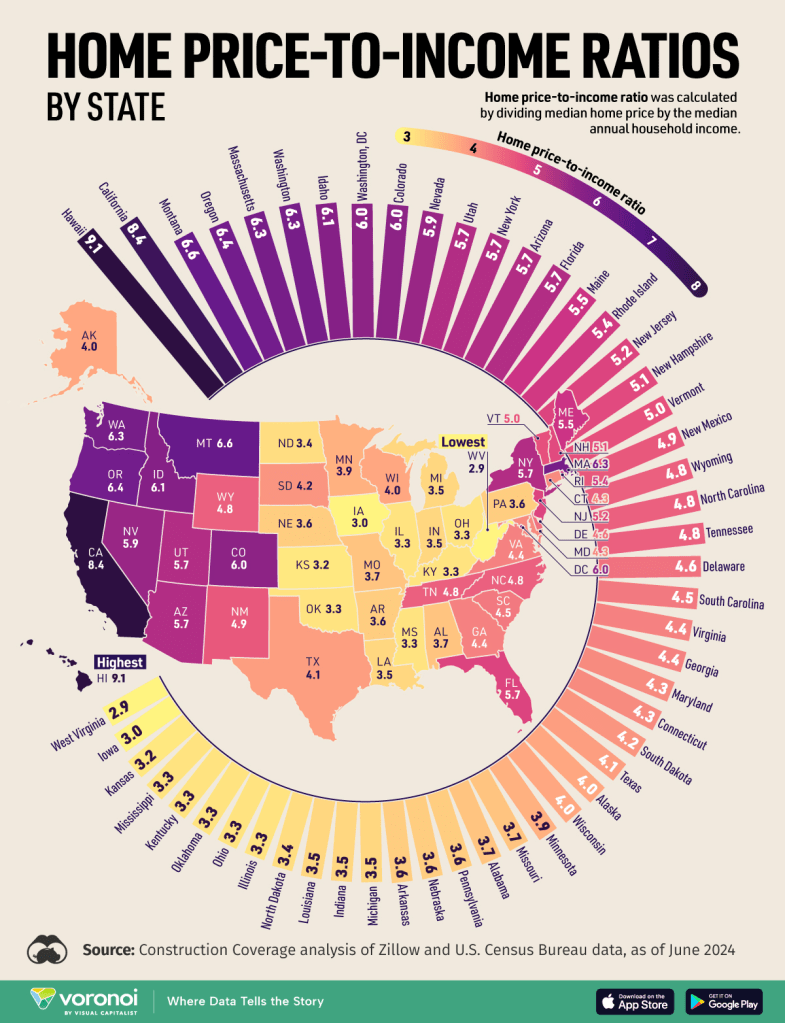
The heat map below shows home price to income ratios by state. The higher the number (darker states), the more unaffordable home ownership is in that state. While this is unfortunate for potential home buyers, it will keep tenants renting longer in those states:
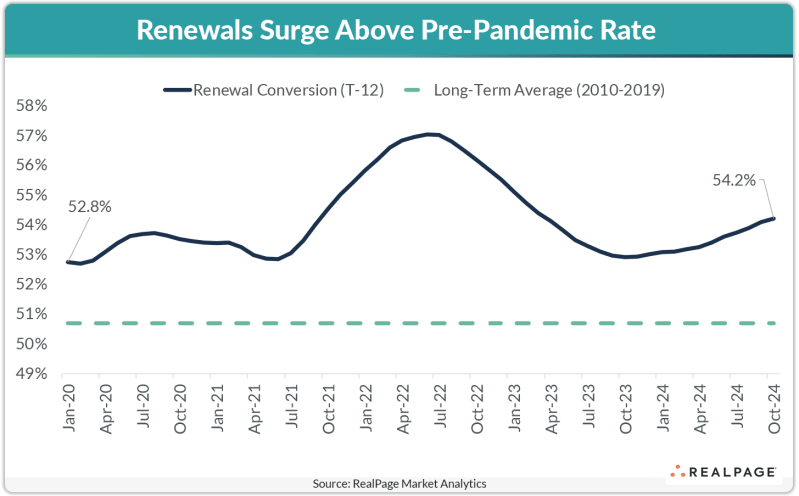
Just over 54% of renters in market-rate apartments renewed their leases in the year-ending October 2024, which was a 120 basis point (bps) climb over last year
“A lot of multi-unit residential in the US — particularly in the Sun Belt — is in trouble,” the chief executive officer of Muddy Waters Capital LLC, said in an interview in London. “That’s the shoe that hasn’t really dropped yet, but that we think will.”
Even before the pandemic, many properties were trading at negative capitalization rates, Block said. Cap rates measure how much net operating income a property generates compared to its value.
Almost $76 billion of apartment complex loans are at risk of distress, according to MSCI Real Assets. That’s partly because many landlords took on floating-rate loans to modernize the properties and have been hit hard by a spike in borrowing costs in recent years.
“A lot more of these things were purchased with ultra cheap money,” Block said, noting that now “financing costs are massively up.”
Wall Street is also on the hook, after many of the debts were bundled into commercial real estate collateralized loan obligations. The share of such instruments that are experiencing some form of distress now stands at more than 12%, according to data provider CRED iQ.
____________________
The Fed Chairman struck a hawkish tone in his press conference last week, tempering market expectations for rate cuts. Other Fed officials have also been cautious on the trajectory of rate cuts. Bloomberg created a Federal Reserve sentiment indicator based on a language processing model, which has risen notably the past few weeks (more hawkish):
Trump’s tariffs may end up being more bark than bite. If you look at every input component for PCE (the Fed’s favorite inflation index), Chinese imports make up only 3.1% of the total (contrast that with the shelter component at close to 20%, which moves on a lag and continues to help lower monthly inflation readings).
During Trump’s first term enacting tariffs, PCE averaged only 1.6% before Covid hit. We live in a different world now in many ways, but tariffs did not send inflation skyrocketing his first time around.
The shelter index (cost of renting) increased by 0.4 percent in November. This data is received on a lag and many economists believe it will fall significantly in the months ahead.
Headline CPI rose 0.20% month-over-month, which re-accelerated the year-over-year rise up to 2.6% (moving further away from the Fed’s 2.0% target)
For the 53rd straight month, core consumer prices rose on a month-over-month basis (0.3%) with the year-over-year re-accelerating to +3.33% (moving further away from the Fed’s 2.0% target)
Supercore inflation, a key metric the Fed follows, is at 4.4% year-over-year
Shelter inflation rose 4.9% year-over-year and has been above 3.0% for 37 straight months
These higher-than-expected inflation readings could slow down the Fed’s pace of rate cuts
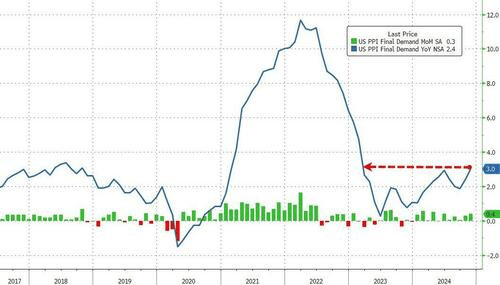
Headline PPI rose 0.2% month-over-month (as expected) but September was revised higher from 0.0% to 0.1%.
Annually, headline PPI rose 2.4%, higher than the 2.3% expected (moving further away from the Fed’s 2.0% target). September was revised higher from 1.8% to 1.9%.
Core PPI (excludes food and energy) rose to 3.1% year-over-year, hotter than the 3.0% expected. The prior month was revised up from 2.8% to 2.9%. This was the second hottest print since March 2023.
These higher-than-expected inflation readings could slow down the Fed’s pace of rate cuts
“The economy is not sending any signals that we need to be in a hurry to lower rates”
“The strength we are currently seeing in the economy gives us the ability to approach our decisions carefully.”
He said the economy was sending no distress signal that might prompt the Fed to accelerate rate cuts, and to the contrary “if the data let us go a little slower, that seems a smart thing to do.”
Powell said the current situation was actually “remarkably good.”
The economy’s strengths include a still-low 4.1% unemployment rate, growth at what Powell called a “stout” 2.5% annual pace that remains above Fed estimates of its underlying potential, consumer spending driven by rising disposable income, and growing business investment.
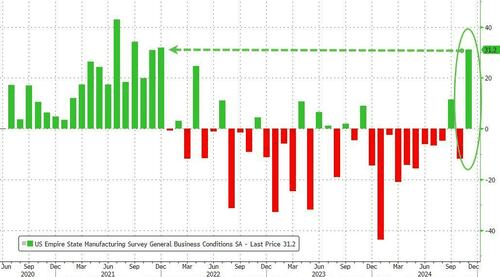
The general business conditions index climbed forty-three points to 31.2, its highest reading since December 2021. There was also a sharp increase in orders and shipments.
It was the second largest month-over-month jump in the survey’s history
This higher-than-expected economic data could slow down the Fed’s pace of rate cuts