When the Fed Funds interest rate is higher than the inflation rate, we have positive real interest rates. That, in turn, applies the brakes on the economy. With Fed Funds at 4.5% – 4.7% and Core PCE at 2.7%, we have positive real rates of 2%, aka braking action.
This is why Powell continues to stress that rates are restrictive. CPI has fallen from 9.1% to 2.6%. Monthly job gains have dropped from 550k to 150k.
The neutral rate is a hypothetical rate where the Fed is neither encouraging or discouraging growth, then you add inflation.
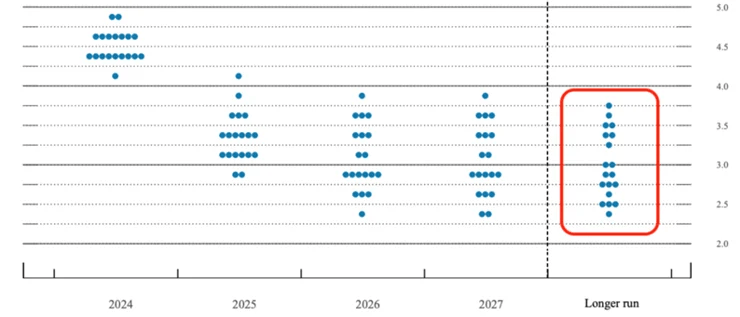
Every other meeting the Fed provides forward guidance through the blue dots seen below. It’s where they think the Fed Funds rate will be at that point in time.
When you read a headline that the Fed’s expectation for long term neutral is 2.8%, it’s really the median blue dot of these projections. Here’s September’s projections:
If the 3.75% dot is accurate, we are just 0.75% away from neutral. If the 2.25% dot is accurate, we are still 2.25% away from neutral. The range is 2.3% – 3.75%. That’s a huge range, which signals uncertainty and a widening difference of opinions.
But every single one of them is below the current level of 4.5% – 4.75%, which is why it’s reasonable to conclude they will keep cutting. It’s also why Chicago Fed President Austan Goolsbee said, “I still think we’re far from what anybody thinks is neutral. We still got a ways to come down.”
For the second consecutive quarter, the multifamily market has posted year-over-year sales gains. The number of properties traded has settled, indicating that the market is finding an equilibrium.
Volume over the past two quarters is in line with quarterly averages from 2015-2017. While it doesn’t match the levels seen during the booming days of 2021 and 2022, it still reflects a time of healthy market activity and liquidity. Given the sector’s continued tailwinds, multifamily looks to remain the most traded asset class for the foreseeable future.
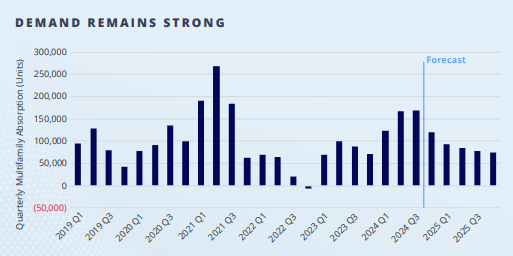
Market fundamentals are nearing an inflection point. New deliveries, which are at multi-decade highs, have been met with near-record demand. Occupancies have slipped, but not to the extent expected given the supply-side pressure.
As this construction cycle abates, and limited groundbreakings follow, occupancies are projected to improve, supporting future rent growth in the quarters, and years ahead. This trend should bring additional capital off the sidelines as investors gain confidence in a near-term market rebound.
The Fed’s preferred measure of inflation (Core PCE) moved up to an annualized rate of 2.8% this month, the highest reading since April (Data released 11/27/24):
The Fed’s inflation target is 2.0%, so if inflation data remains sticky in this range or continues to move higher, it will make it more difficult to continue cutting rates unless unemployment begins to rise to worrisome levels
Trepp data reveals there are currently more than 5,800 multifamily loans representing $96 billion with a DSCR below one.
79% of these loans comprise of floating-rate debt with a weighted average interest rate of 7.8% today.
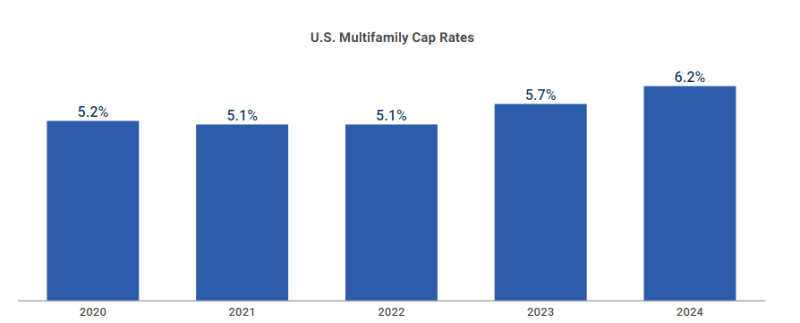
The estimated cap at securitization for multifamily properties has been in the 5.2% to 5.7% range in recent years.
In addition to higher borrowing costs, multifamily owners have been dealing with rising operating expenses in the form of higher property taxes, insurance, repairs and maintenance, and increased labor costs.
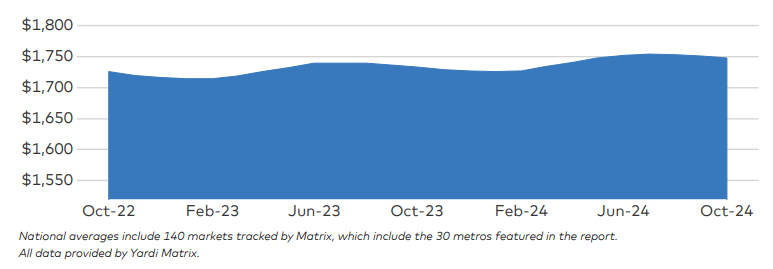
Rental rate growth has remained largely lackluster as the market digests the current supply wave.
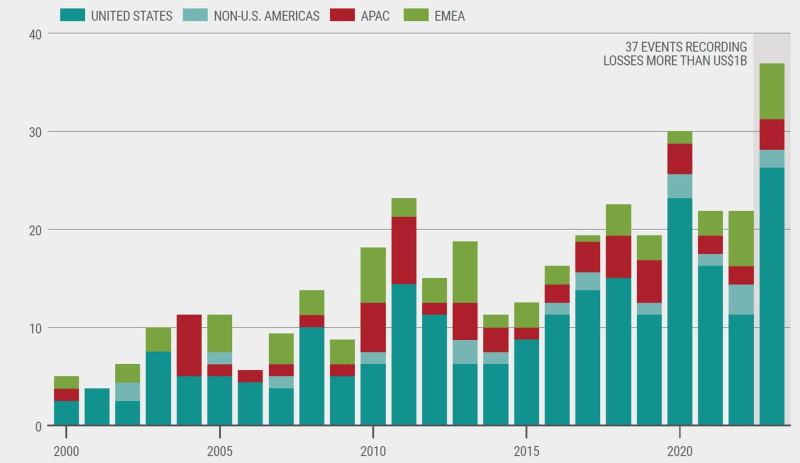
The year 2023 set records as the warmest on record, accompanied by 28 separate billion-dollar weather and climate disasters. These events caused $92.9 billion in damages nationwide.
More frequent and severe natural disasters and the increasing development of high-value properties in areas prone to hazards have put increased pressure on the insurance industry.
In 2022, U.S. losses accounted for 75% of total global insured losses.
Swiss Re, a leading reinsurer (insurance company that insures insurance companies), anticipates insured losses could double in the next decade due to extreme weather events
Rising Claims Costs, Litigation Pressures, and Construction Cost Inflation
Litigation costs from plaintiffs pursuing substantial compensation for injuries or additional payments for disputed property damage have steadily increased by an average of 2 percent annually since 2015. These claims have added to increased insurance costs, which get passed down to the consumer.
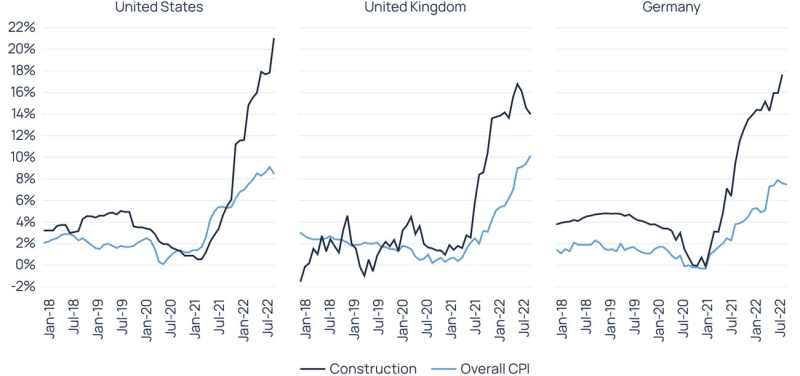
Inflationary pressures on material and labor costs have increased the price to rebuild damaged properties, further escalating claims costs.
Dramatic Cost Increases
For residential apartments, insurance costs as a percentage of total expenses rose from 4% to 7% in 2024, according to the National Council of Real Estate Investment Fiduciaries (NCREIF) Property Index, but some areas are seeing even worse increases.
Strained Operating Margins
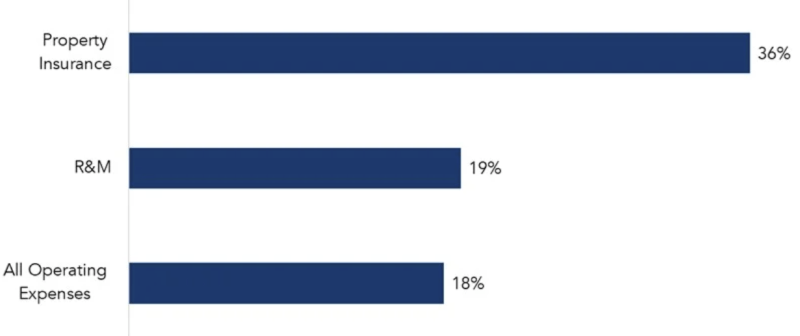
Operating expenses for commercial real estate increased by more than one-third from 2017 to 2022, with insurance costs rising by 73% during this period.
Reduced rental demand: Slowing immigration could lower the number of renters entering the market, decreasing occupancy rates and cooling some of the strength we’ve seen in absorptions during recent quarters, which also coincided with record levels of immigration.
By our estimates, from 2022–2024, immigration was responsible for all of the 1.0 million net growth in renter households.
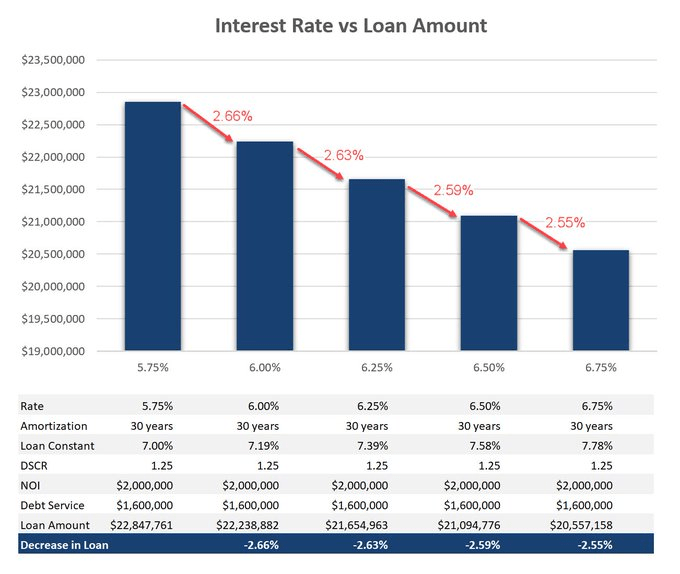
For every 25-basis point increase in interest rates, loan proceeds decrease by approximately 2.6%
If rates have gone up 50 basis points since you last updated your model, then your loan amount will be ~5.2% lower
The example in the chart below uses a $2MM NOI, but the same relationship exists regardless of NOI
Loan Constant = Your annual debt service divided by the loan amount. It takes into account the amortization, so if a loan is interest-only, then your interest rate and your loan constant are the same.
DSCR = Debt Service Coverage Ratio. This is your NOI divided by debt service. Most lenders typically want the NOI to be at least 1.25x the annual debt service.
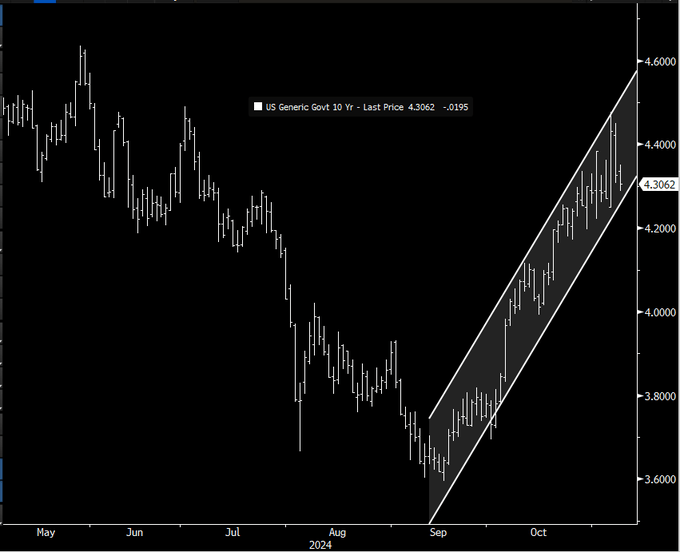
The 10-year treasury yield has risen 70 basis points since mid-September, which reduces loan proceeds and estimated IRR returns
If you’re scared of US fiscal health, pick another country’s 10-year bond yield to invest in instead of the United States’ 10-year which is currently at 4.45%:
Germany – 2.35%
Australia – 4.45%
Japan – 1.05%
UK – 4.47%
Canada – 3.28%
France – 3.08%
Spain – 3.05%
China – 2.06%
Italy – 3.55%
Greece -3.18%
Not a single developed nation has higher yields than the US. Shouldn’t that help keep a lid on US rates?
“But deficits!” A very solid point. Thankfully, we have precedence when markets get nervous about US fiscal health. What happened when the US lost its AAA rating in 2011? The 10-year yield fell from 3.0% down to 1.8%.
We’re at 120% of debt to GDP – not good. But we crossed that threshold in 2015, and rates didn’t spike. Inflation didn’t take off. The world didn’t end. Japan crossed 100% debt to GDP in 2000. They currently sit > 200%. Did their rates spike? No, it was gigantic news when their interest rates finally turned positive last year. Their 10-year is 1.05% currently.
Fannie Mae and Freddie Mac will each be provided with $73 billion in lending capital for multifamily properties in 2025 – a combined total of $140 billion.
At least 50% of the capital must be put toward mission-driven affordable workforce housing and they have no limits on how much they lend on those properties
The caps are up from $70 billion each in 2024, although Fannie Mae’s volume is only at $38.5 billion so far this year
This means the GSE’s have plenty of ammunition to lend and will continue to provide liquidity to the multifamily debt market
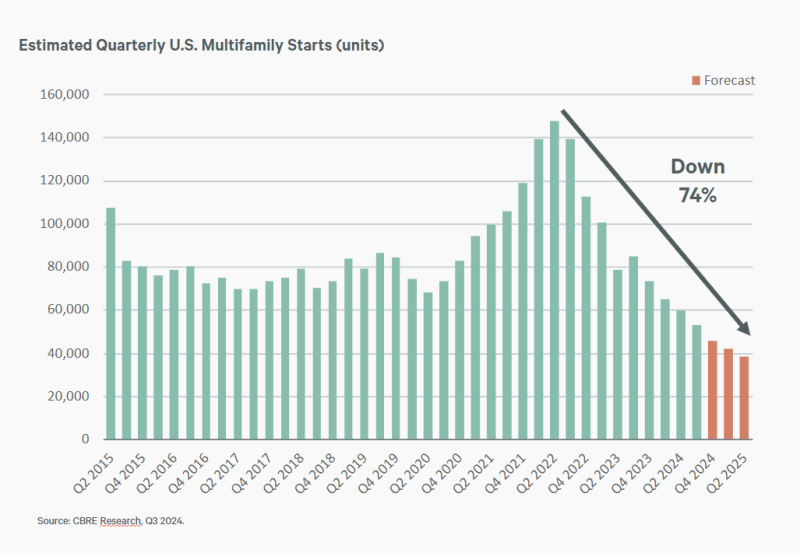
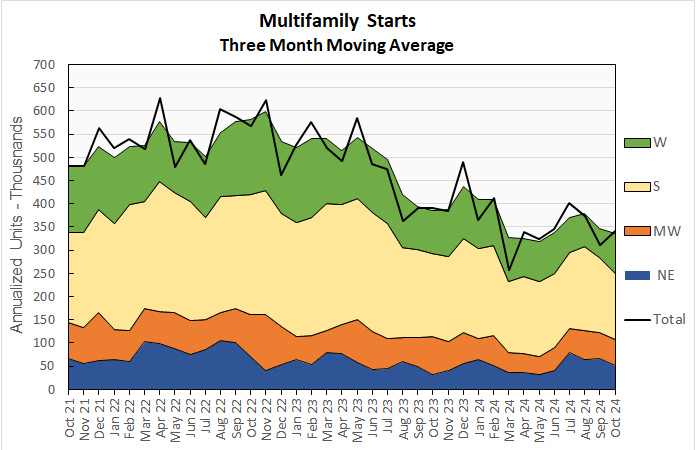
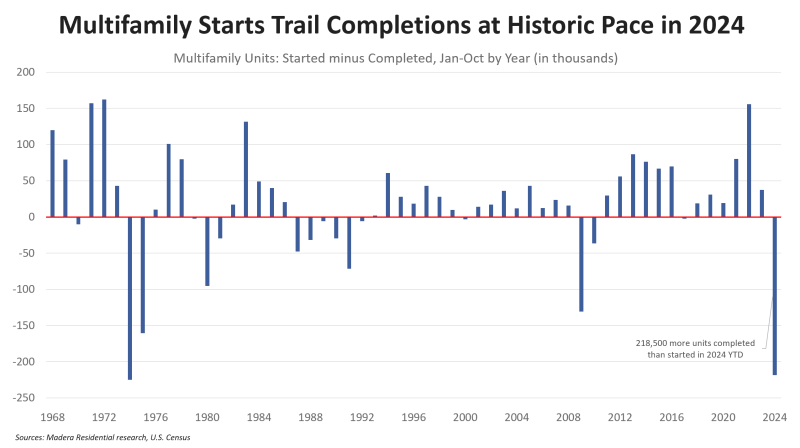
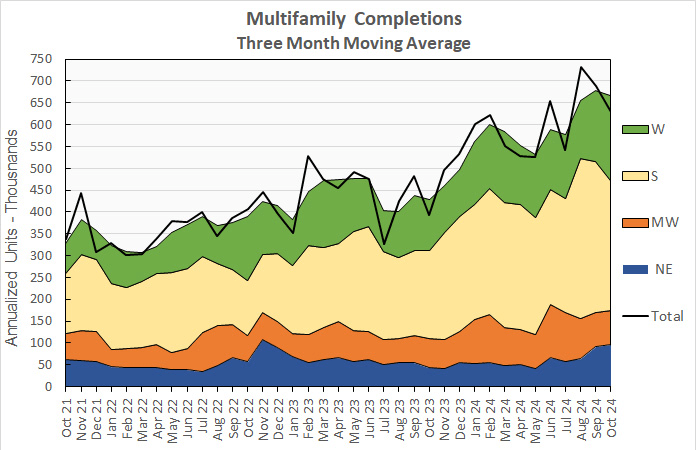
Multifamily starts for October came in lower than any October in the last 12 years. Year-to-date, completions are outpacing starts by 218,500 units. This is a massive deficit that will significantly reduce apartment supply in 2026. Source: Jay Parsons (11/19/24)
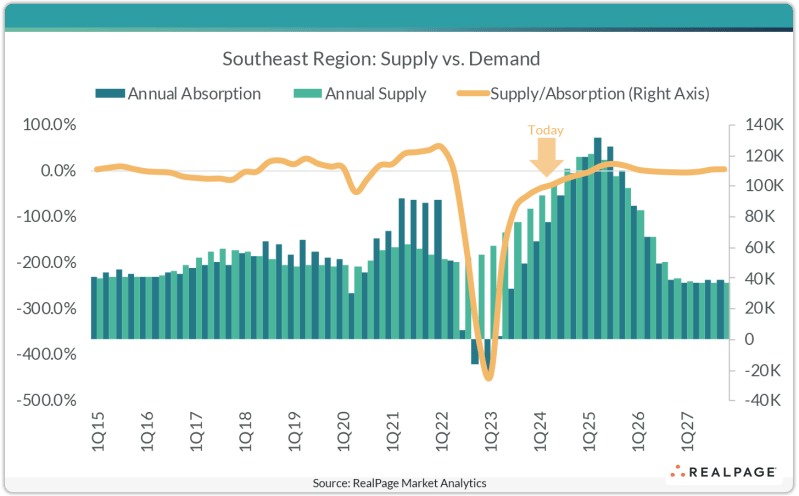
Apartment demand has been significant in the Southeast and is catching up to record supply levels. The Southeast region of the country, which covers markets across Florida, Georgia, Alabama, South Carolina and North Carolina, has seen sizable supply volumes recently. Roughly 111,200 units delivered in this region in the year-ending 3rd quarter 2024. Atlanta was the region leader with over 25,000 units coming online in the past year.
Meanwhile, apartment demand across the Southeast has been catching up as the region absorbed more than 93,600 units in that same time frame. Again, Atlanta was the region’s leader for demand, with 20,100 units absorbed in the past year. While demand is still about 17% behind concurrent supply volumes in the Southeast, that marked a significant improvement from the 80% delta from one year earlier. In the near-term outlook, demand is expected to get even closer to supply, closing the gap even further.
The rate at which workers quit their jobs in September was 1.9% — the lowest since June 2020 and, outside of Covid, a level last seen in 2015.
The number of job openings in September was 7.4 million — a decline of 1.9 million from the previous year.
An increasing share of those who do job hop are settling for lower paychecks. Some 17% of job switchers this year took a pay cut.
Employers are sitting tight,says Daniel Zhao, lead economist at job site Glassdoor. Companies aren’t making big changes to hiring strategy. That means “fewer opportunities for workers to climb the career ladder.” They’re still plugging away at the same role they’ve had for years without the opportunity to move up internally or at a new company.
65% of the 3,400 professionals surveyed by Glassdoor last month said they feel stuck in their current role.
A weaker jobs market would increase the Fed’s speed and quantity of rate cuts
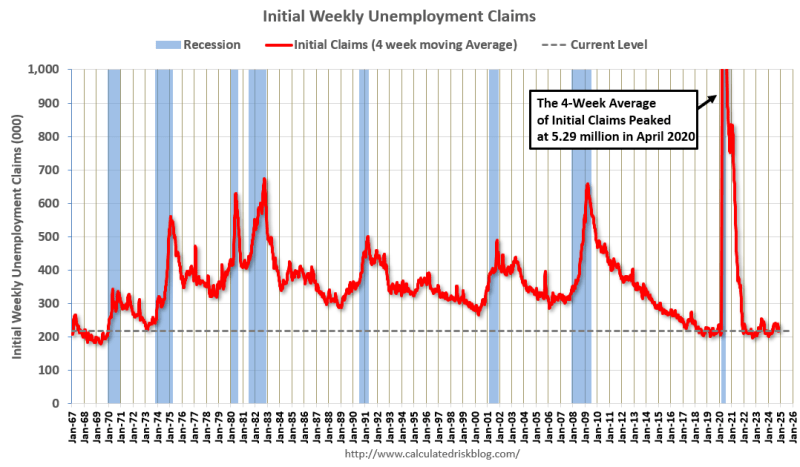
With permits, starts, and housing units under construction all down from their peaks, at levels at least close to consistent with an oncoming recession, the big item to look for is employment in residential construction, and construction generally.
If manufacturing employment remains negative, and construction employment turns down, that would strongly indicate that more likely than not a recession is approaching.
A weaker jobs market would increase the Fed’s speed and quantity of rate cuts
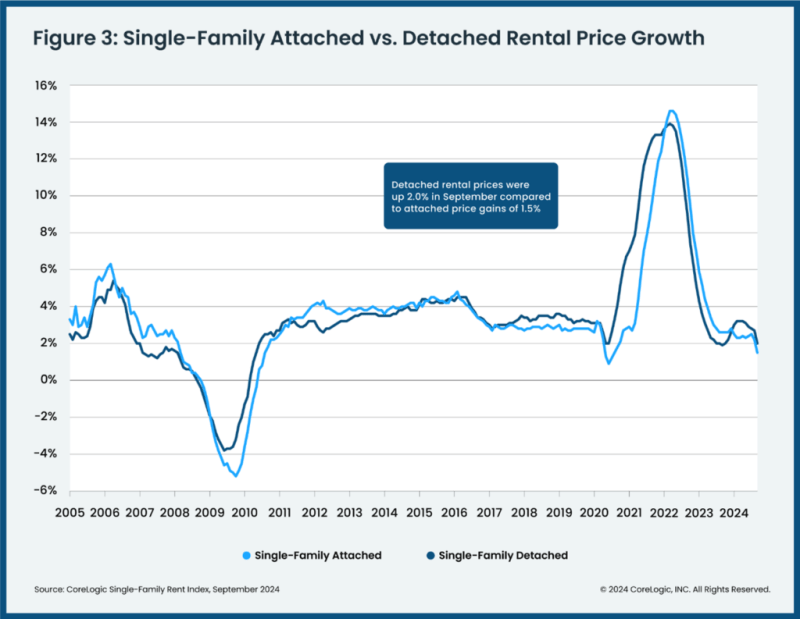
Annual U.S. single-family rent growth registered a 2% increase, continuing a slowing trend that began in early 2024
Single-family rents are a large component of the CPI (inflation index). It tracks on a lag, so if rents continue to cool for single-family homes, it will continue to lower monthly inflation readings in the months ahead (allowing the Fed more room to cut rates)
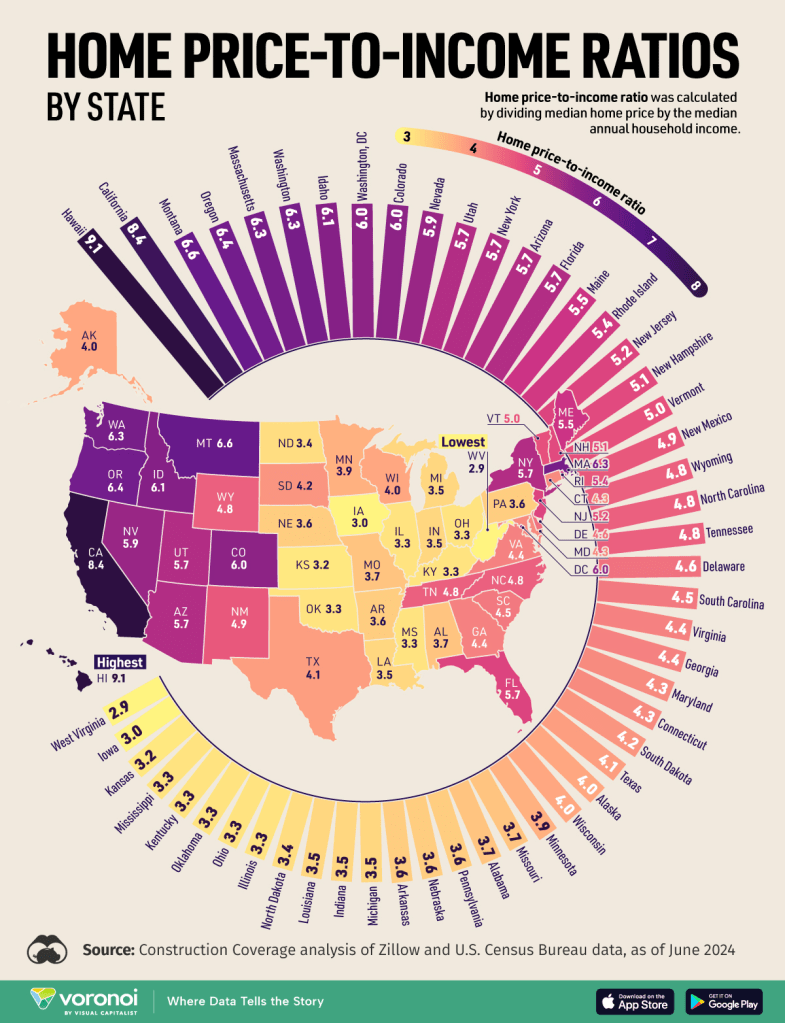
The heat map below shows home price to income ratios by state. The higher the number (darker states), the more unaffordable home ownership is in that state. While this is unfortunate for potential home buyers, it will keep tenants renting longer in those states:
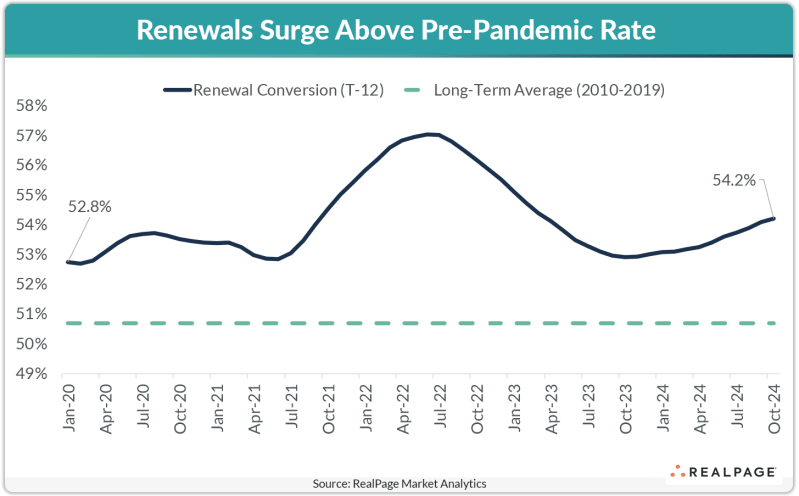
Just over 54% of renters in market-rate apartments renewed their leases in the year-ending October 2024, which was a 120 basis point (bps) climb over last year
“A lot of multi-unit residential in the US — particularly in the Sun Belt — is in trouble,” the chief executive officer of Muddy Waters Capital LLC, said in an interview in London. “That’s the shoe that hasn’t really dropped yet, but that we think will.”
Even before the pandemic, many properties were trading at negative capitalization rates, Block said. Cap rates measure how much net operating income a property generates compared to its value.
Almost $76 billion of apartment complex loans are at risk of distress, according to MSCI Real Assets. That’s partly because many landlords took on floating-rate loans to modernize the properties and have been hit hard by a spike in borrowing costs in recent years.
“A lot more of these things were purchased with ultra cheap money,” Block said, noting that now “financing costs are massively up.”
Wall Street is also on the hook, after many of the debts were bundled into commercial real estate collateralized loan obligations. The share of such instruments that are experiencing some form of distress now stands at more than 12%, according to data provider CRED iQ.
____________________
The Fed Chairman struck a hawkish tone in his press conference last week, tempering market expectations for rate cuts. Other Fed officials have also been cautious on the trajectory of rate cuts. Bloomberg created a Federal Reserve sentiment indicator based on a language processing model, which has risen notably the past few weeks (more hawkish):
Trump’s tariffs may end up being more bark than bite. If you look at every input component for PCE (the Fed’s favorite inflation index), Chinese imports make up only 3.1% of the total (contrast that with the shelter component at close to 20%, which moves on a lag and continues to help lower monthly inflation readings).
During Trump’s first term enacting tariffs, PCE averaged only 1.6% before Covid hit. We live in a different world now in many ways, but tariffs did not send inflation skyrocketing his first time around.
The shelter index (cost of renting) increased by 0.4 percent in November. This data is received on a lag and many economists believe it will fall significantly in the months ahead.
Headline CPI rose 0.20% month-over-month, which re-accelerated the year-over-year rise up to 2.6% (moving further away from the Fed’s 2.0% target)
For the 53rd straight month, core consumer prices rose on a month-over-month basis (0.3%) with the year-over-year re-accelerating to +3.33% (moving further away from the Fed’s 2.0% target)
Supercore inflation, a key metric the Fed follows, is at 4.4% year-over-year
Shelter inflation rose 4.9% year-over-year and has been above 3.0% for 37 straight months
These higher-than-expected inflation readings could slow down the Fed’s pace of rate cuts
Headline PPI rose 0.2% month-over-month (as expected) but September was revised higher from 0.0% to 0.1%.
Annually, headline PPI rose 2.4%, higher than the 2.3% expected (moving further away from the Fed’s 2.0% target). September was revised higher from 1.8% to 1.9%.
Core PPI (excludes food and energy) rose to 3.1% year-over-year, hotter than the 3.0% expected. The prior month was revised up from 2.8% to 2.9%. This was the second hottest print since March 2023.
These higher-than-expected inflation readings could slow down the Fed’s pace of rate cuts
“The economy is not sending any signals that we need to be in a hurry to lower rates”
“The strength we are currently seeing in the economy gives us the ability to approach our decisions carefully.”
He said the economy was sending no distress signal that might prompt the Fed to accelerate rate cuts, and to the contrary “if the data let us go a little slower, that seems a smart thing to do.”
Powell said the current situation was actually “remarkably good.”
The economy’s strengths include a still-low 4.1% unemployment rate, growth at what Powell called a “stout” 2.5% annual pace that remains above Fed estimates of its underlying potential, consumer spending driven by rising disposable income, and growing business investment.
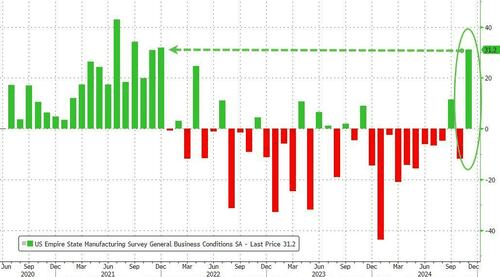
The general business conditions index climbed forty-three points to 31.2, its highest reading since December 2021. There was also a sharp increase in orders and shipments.
It was the second largest month-over-month jump in the survey’s history
This higher-than-expected economic data could slow down the Fed’s pace of rate cuts
Asheville is scheduled to see 3,549 units deliver in calendar 2025, which marks the highest delivery load in the RealPage Market Analytics data set and translates to the highest annual inventory increase in the nation at 13.3%.
It’s no surprise to see Asheville top this list, as this market has grown at one of the fastest clips nationwide in the past 10 years. Still, even in a decade of elevated supply, the small North Carolina market’s annual delivery volume has averaged below 1,000 units.
The Bull Case: Why Rates Would Move LOWER From Here:
From Jerome Powell (The Fed Chairman)’s press conference and Q&A November 7 after cutting an additional 25 basis points:
“We are on a path towards a more neutral stance and that has not changed at all.”
“We don’t start modeling things like tax cuts until they are closer to becoming law.”
“The labor market has cooled a great deal from two years ago. The labor market continues to cool.”
“Inflation has moved down a great deal from its high two years ago. If you look at Core PCE over 3 and 6 months, it’s just 2.3% We would be concerned if we saw inflation expectations anchoring at a higher level, but that’s not what we’re seeing. We will not allow inflation expectations to drift upward.”
“A couple of data points, good or bad, won’t really change the pattern now that we are this far down in the process.”
He repeatedly said they will be more sensitive to risks/noise after they get closer to neutral.
The Bear Case: Why Rates Would Move HIGHER From Here:
From Jerome Powell (The Fed Chairman)’s statement and Q&A November 7:
“We know the destination but don’t know the pace. “But nothing in the economic data suggests the Committee needs to be in a hurry to get to neutral.”
“As we approach levels that are plausibly neutral, we could slow the pace of cuts.”
Right now, the market is pricing the neutral rate at 2.88% (orange line below). If that’s where the Fed ultimately lands with the Fed Funds rate, then historically the 10-year treasury is about 1.50% above that rate. That would put the 10-year at 4.38%, right about where it is today. If the neutral moves higher (it has been rising since March), then that resets the entire yield curve higher:
The five-year breakeven rate, the difference in yield between nominal and inflation-adjusted five-year treasuries (a gauge of inflation expectations) is up to 2.5% from only 1.8% in September. The 10-year breakeven hit 2% in September but has climbed back up to 2.4%.
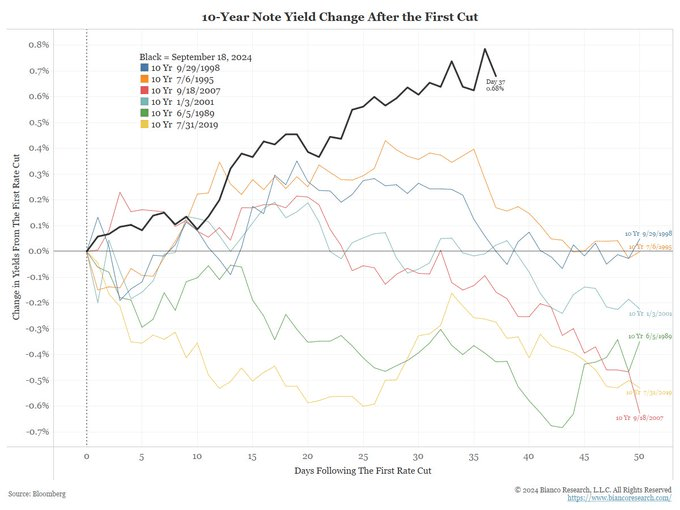
Powell seemed unconcerned at the press conference by the recent rise of the 10-year treasury yield after their first 50 point cut in September (see dark black line in graph below comparing the 10-year rise to how it behaved the last six times the Fed started cutting rates). He doesn’t see a correlation (yet) to the idea that cutting rates while the economy is so strong could perversely create a rise in the long end of the yield curve (rate cuts could reignite inflation, create stronger growth, weaken the currency, etc.).
From Powell: “I — look, I just think — the first question is how long will they be sustained? If you remember the — the 5 percent 10-year, people were drawing massively important conclusions, only to find, you know, three weeks later, that — that it — the 10 year was 50 basis points lower. So, you know, it’s — it (inaudible) — it’s material changes in financial conditions that last, that are persistent that really matter. And we don’t know that about these. What we’ve seen so far, you know, we’re watching it, we’re reading — you know, we’re — we’re doing the decompositions and reading others, but right now, it’s not a major factor in — in how we’re thinking about things.”
The MOVE (the bond market’s VIX – volatility index) has collapsed in the last two days, which is understandable now that the election and Fed meeting have passed. The fact that the MOVE fell, and the 10-year yield moved from 4.28% to 4.35% simultaneously suggests that this yield rise was not a response to higher volatility. Lower volatility may not help yields go down.
The two-year treasury yield, going back decades, has been a good forward indicator of the Fed’s upcoming moves. It is not projecting major easing ahead:
Strong Economic Data:
The most recent GDP report showed the economy growing at 3%
Atlanta Fed’s tracker estimates 2.4% GDP growth this quarter
Unemployment is only 4.1%; historically low
Supply:
The nonpartisan Committee for a Responsible Federal Budget estimates Trump’s spending plans could add up to $15 trillion in deficits over the next 10 years
The U.S. budget deficit is the largest among OECD countries (as a percentage of GDP):
From a technical perspective, the move higher in rates has stayed within a steady channel which bond traders view as an uptrend:
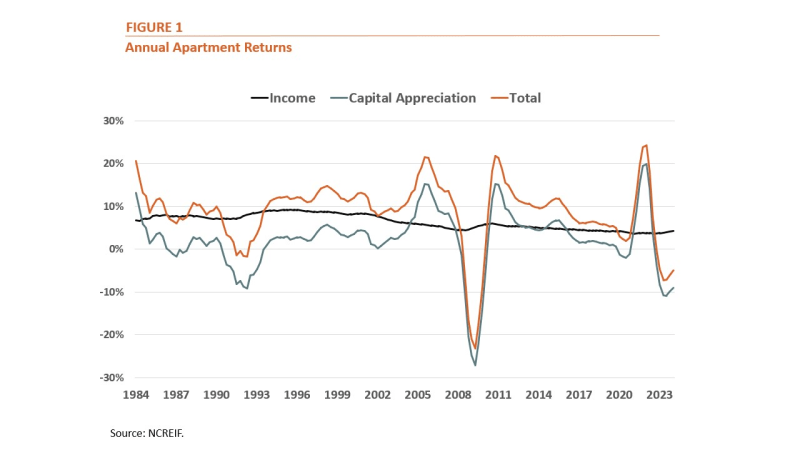
Data from NCREIF shows that total, unlevered returns for apartment investors averaged 8.2% annually over the past 40 years. However, returns have been lower in recent years, averaging 6.0% annually over the last decade and 4.2% over the past five years.
The graph below shows that volatility in apartment returns is driven primarily by changes in the price of apartment properties as opposed to the income that they produce, which has remained relatively constant over time.
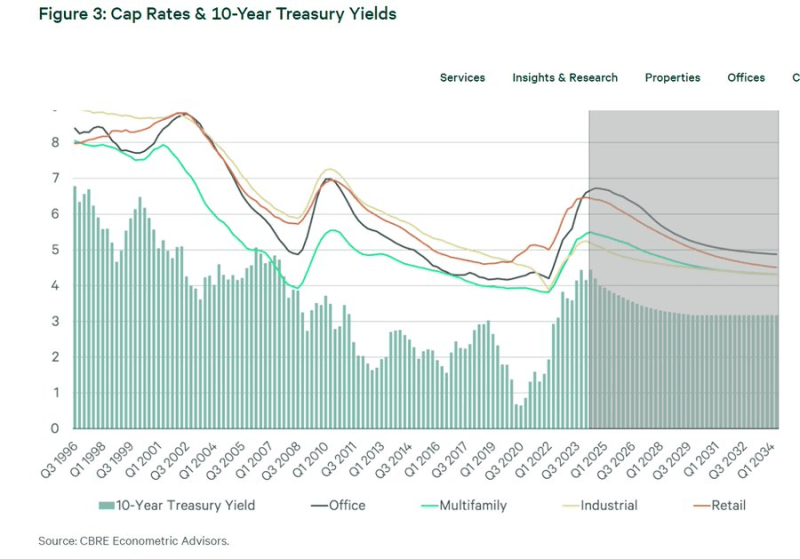
The 28 year relationship between the 10 year treasury yield and cap rates on different commercial real estate sectors. For every 100 basis point move in the 10 year treasury, multifamily cap rates move about 70-80 basis points.
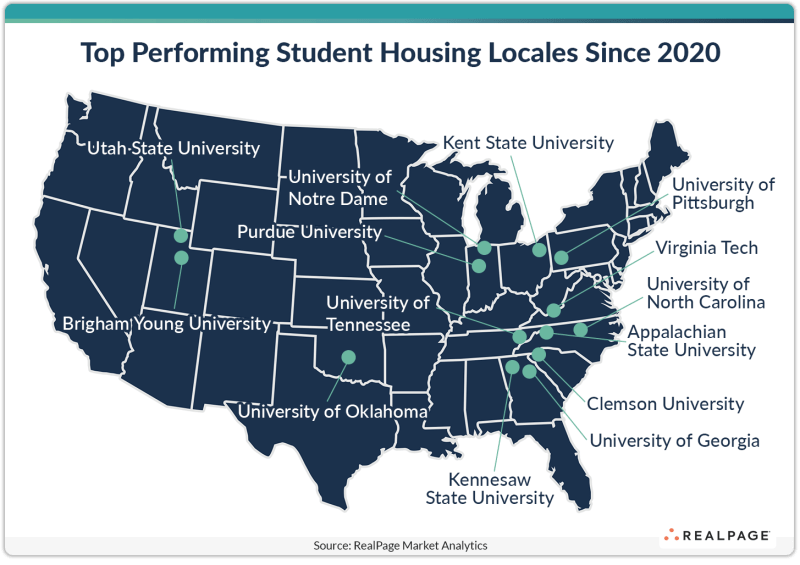
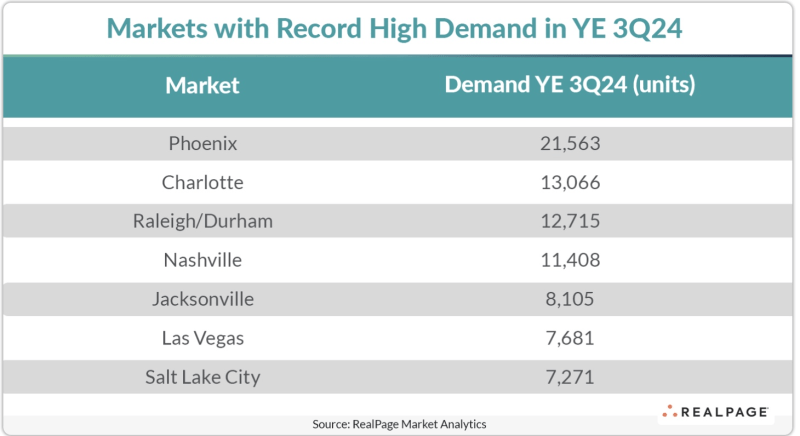
These seven markets have several tailwinds aiding their record demand performances. For one thing, they’re all experiencing favorable demographics to support housing demand. Populations in these seven markets have all grown at rates at least double (and in some cases, triple) the national norm since 2017, according to the U.S. Census Bureau.
Raleigh, Nashville and Jacksonville have all grown total populations over 10% in the five-year period ending in 2022, which is the latest Census data available. Nationwide, population growth during that time was 3.1%.
Job growth tends to run higher and unemployment tends to run lower than national averages in these markets, further supporting housing demand.