The Most Taxed States In The U.S.

1Hawaii13.9%
2New York13.6%
3Vermont11.5%
4California11.0%
5Maine10.6%
6New Jersey10.3%
7Illinois10.2%
8Rhode Island10.1%
9Maryland10.0%
10Connecticut9.9%
11Minnesota9.7%
12New Mexico9.6%
13Massachusetts9.6%
14Utah9.5%
15Ohio9.4%
16Kansas9.3%
17Iowa9.2%
18Indiana9.1%
19Mississippi9.1%
20Oregon9.1%
21Louisiana8.9%
22Kentucky8.9%
23Virginia8.9%
24West Virginia8.9%
25Nebraska8.8%
26Colorado8.7%
27Nevada8.6%
28Washington8.6%
29Arkansas8.6%
30Pennsylvania8.6%
31Georgia8.5%
32Wisconsin8.3%
33Michigan8.3%
34Arizona8.2%
35North Carolina8.2%
36South Carolina8.2%
37Alabama8.0%
38Montana7.9%
39Missouri7.8%
40Texas7.8%
41Idaho7.5%
42Oklahoma7.0%
43North Dakota6.6%
44Delaware6.5%
45Florida6.5%
46South Dakota6.5%
47Tennessee6.4%
48New Hampshire5.9%
49Wyoming5.8%
50Alaska4.9%

Changes To State Income Taxes Since 2000

The graphic below shows how state income taxes have changed between 2000 and 2025. The gray states have no taxes. Changes are not compared for four states (Rhode Island, Vermont, North Dakota, and Colorado) since their 2000s tax rates were charged as a percentage of federal liabilities owed. As a result, they have been grayed out on the map

And the highest marginal income tax by state, shown below:

The Multifamily Bull Case: This Week’s Data

The Federal Reserve’s Interest Rate Decision, Statement & Press Conference – 3/19/25

The most significant part of the Fed’s statement is the reduction in the “redemption cap” on Treasury securities from $25 billion to $5 billion. This refers to the pace at which the Fed allows its balance sheet to shrink.

When Treasury securities on the Fed’s balance sheet mature, the Fed has a choice between doing nothing (a form of monetary tightening) or rolling over the position by buying new securities (a form of monetary ease or QE). By lowering the cap, there will be more rollovers and less balance sheet reduction. That is a dovish move that indicates monetary easing – a backdoor form of QE or even a rate cut.

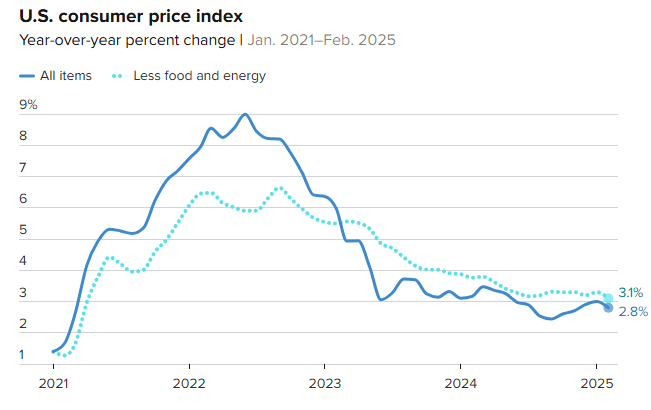
The Fed lowered its inflation expectations and reduced its 2025 U.S. growth forecast from 2.1% to 1.7%. They also kept the unemployment forecast unchanged. Taken in combination with the decision to reduce the run-off in the balance sheet, this is a slightly dovish turn of events. It certainly strengthens the case for a rate cut at the Fed’s next meeting on May 7.

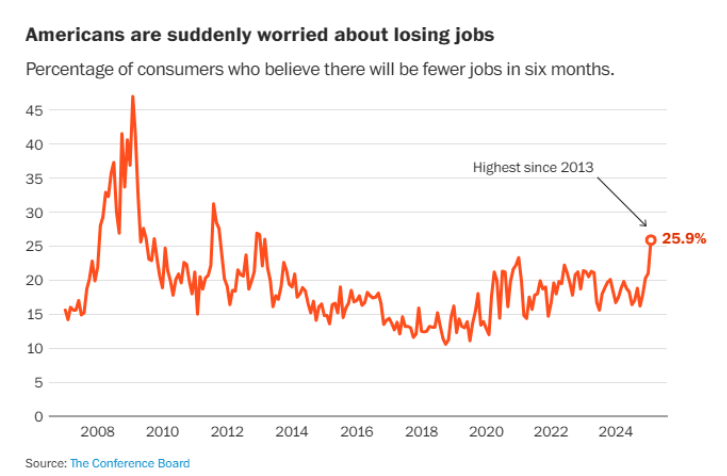
The U.S. unemployment rate hit an interim low of 3.4% in January 2023. From there, it rose to 3.9% in February 2024 then 4.2% in July 2024. Today, the unemployment rate is 4.1%, down slightly from last July but up significantly from January 2023. the labor situation and prospects for growth are worse than the headlines indicate. The household survey, a Labor Department survey different than the employer survey used to calculate the official unemployment rate, showed significant job losses in February. The number of employed individuals per the household survey dropped by 588,000. The Labor Force Participation Rate (total employed divided by total workforce) also dropped from 62.6% to 62.4%. 

Major U.S. companies are issuing warnings that earnings in the first quarter will not meet expectations. Walmart, Best Buy, Target, Kohl’s, American Airlines and Delta Airlines are among those who have revised earnings and revenue forecasts downward. These and other developments point in the direction of higher unemployment and slower growth (if not recession).

The Multifamily Bear Case: This Week’s Data

The Federal Reserve’s Interest Rate Decision, Statement & Press Conference – 3/19/25

Inflation moving in the wrong direction: The trend reversed suddenly in October 2024 when inflation rose to 2.6%. It then rose further in November 2024 hitting 2.7% then rose again to 3.0% in January 2025, the highest rate since last July. The reading for February 2025 was 2.8%, (the latest data available).

From Powell: “A good part of [expected inflation] is coming from tariffs” and “inflation may be moving up due to tariffs.” Powell added that, “There are going to be tariffs and in the short-term they tend to bring inflation up.”

__________________________________

CRE & Multifamily Debt: Extend & Pretend Continues Into 2025

  • Nearly half of all commercial real estate loan maturities expected to hit this year were pushed back from years prior as the extend-and-pretend game continues.
  • Of the $957 billion in commercial real estate debt coming due in 2025, $348 billion was due last year and was pushed into 2025
  • Multifamily represents the highest volume of extensions within all CRE sectors
  • There’s an additional $663 billion in CRE debt that needs to be refinanced in 2026

___________________________________

The Rising Cost Of Insurance Continues To Challenge Multifamily Operations

  • Over 50 percent of the overall operating expense inflation for multifamily housing owners since 2020 can be attributed to increases in property insurance premiums.
  • From 2021 to 2022, respondents reported an average annual premium increase of 14 percent, followed by 22 percent from 2022 to 2023, and a staggering 45 percent from 2023 to 2024. By 2024, property insurance premiums were, on average, double those in 2021.
  • Rising property insurance costs are forcing owners to choose between increasing deductibles or reducing coverage to mitigate higher costs, leaving them vulnerable in the event of property damage.
  • Owners are frustrated with the increasing number of coverage exclusions, indicating that fewer causes of damage are eligible for reimbursement. They are saying that there are so many exclusions that a new policy is like a book. You nearly need an attorney to read it to see if you actually have any coverage. 
  • Insurers most often tie premium increases to weather risks, claims histories, and buildings’ physical characteristics, explanations that survey respondents generally found unsatisfying. 
  • Rising insurance costs have particularly dire implications for affordable housing providers. They have less flexibility to raise rents to cover increasing insurance costs and often face stricter limits on rent increases due to funding requirements.

__________________________________________

A New Problem For Fractured Condo Investors: Insurance – 3/17/25

  • Condominium owners across the country are facing a paralyzing problem: They can’t sell their properties because of a fast-growing and mostly secret mortgage blacklist.
  • The blacklist is maintained by Fannie Mae and includes condo associations that the mortgage finance giant thinks don’t have adequate property insurance or need to make critical building repairs. Being on the list can make it harder for potential buyers to get a mortgage.
  • Fannie Mae greatly expanded the list after the Surfside condo collapse in Florida in 2021 killed 98 people. Compounding the problem, a nationwide insurance crisis is making it more expensive for condo associations to afford adequate coverage. 
  • The number of properties that fail to meet Fannie Mae’s standards has risen to 5,175 this month from a few hundred before Surfside

The Multifamily Bull Case: This Week’s Data

Monthly Consumer Price Inflation (CPI) Report – March 12, 2025

  • Rose 0.2% on the month and 2.8% year-over-year, which were below expectations
  • Core CPI (excludes food and energy) also rose 0.2% on the month and 3.1% annually, which were also below expectations
  • What It Means: A lower-than-expected inflation print provides the Fed more room to cut rates in the months ahead if the employment market shows weakness
  • CPI rent inflation (a notably lagged measure of rents) continues its rapid cooling and is now within just 36 basis points of pre-COVID norms.
  • If you exclude rent/shelter inflation, headline CPI is already at 2.0% (the Fed’s target)

________________________________________

The government’s CPI data is for the month of February. The Truflation index is a private data company that measures inflation based on real-time inputs. It has shown a sharp decline starting at the end of February and is now down to only 1.32%:

__________________________________________

Apartment retention in February hit the highest level in 2.5 years. It was also the highest February retention rate in 15 years, behind only February 2022.

_______________________________________

Another reason why tenants are continuing to rent instead of trying to buy a home:

__________________________________

25% of jobs added in the US economy over the past two years were government jobs, up from 5% in 2021 and 7% in 2022. If hiring turns into net layoffs in 2025, it could severely impact the jobs market (leading to the Fed cutting interest rates faster than anticipated).

The Multifamily Bear Case: This Week’s Data

University Of Michigan’s Inflation Expectations Report Saw Another Brutal Rise In March:

  • Year-ahead inflation expectations jumped to 4.9% from 4.3%.
  • Three consecutive months of unusually large increases of 0.5 percentage points or more.
  • This month’s rise was seen across all three political affiliations.
  • Long-run inflation expectations surged to 3.9% in March from 3.5%.
  • This was the largest month-over-month increase seen since 1993, stemming from a sizable rise among Independents, and followed an already-large increase in February.

North & South Carolina New Multifamily Supply

More than 59,400 units are under construction across North and South Carolina with an expected 45,700 of those units coming online in 2025. Virtually all of those units underway across the Carolinas are concentrated in six of the region’s 10 markets:

  1. Charlotte, NC: The largest market in the Carolinas had 25,064 units underway at the end of 2024. No stranger to new apartment supply, Charlotte has grown total inventory nearly 29% over the last five years, well above the national pace of roughly 11%. The 18,863 units expected to deliver to Charlotte in 2025 would set a 29-year high. With those new units, Charlotte’s existing unit base would expand another 7.8%
  2. Raleigh/Durham, NC: 13,799 units under construction in 4th quarter 2024, with 10,353 of those units expected to complete in 2025. Those new units would increase the unit base 5.0% this year. That growth rate comes on the heels of a prolonged supply wave as this market has grown total inventory 25% in the last five years.
  3. Asheville, NC: Punching above its weight in terms of new supply, developers are expected to add 3,509 units this year in Asheville, a small market in western North Carolina’s Blue Ridge Mountains. That would grow the existing unit count (26,745 units) a massive13.1%, notably above the U.S. norm. Over the past five years, the inventory base in Asheville has expanded 19.7%.
  4. Charleston, SC: Jumping to the Atlantic coast of South Carolina, supply is expected to climb with 3,867 units under construction. The majority of those units (3,213 units) are projected to complete in 2025, expanding total inventory 4.2% this year. This market has experienced a much smaller supply wave then neighboring markets as total inventory here has only grown 4.9% in the last five years.
  5. Greensboro, NC: Apartment inventory has expanded roughly 7% over the past five years. At the end of 2024, there were 3,458 units under construction with 2,664 of those units scheduled to complete in 2025. That would expand total inventory another 2.3% this year.
  6. Wilmington, NC: 3,212 units were underway at the end of 2024. This year, 2,438 of those units are expected to complete, growing total inventory 8.0%. In the last five years, this market has grown total inventory a staggering 36%

Four other markets round out the 10 largest apartment markets in North and South Carolina.

  • Myrtle Beach, SC: 2,168 units of new supply in 2025, growing inventory 4.0%. Existing unit count has expanded 31.2% over the last five years.
  • Greenville/Spartanburg, SC: During the past five years, inventory ballooned 20.8%. Another 1,200 units are expected to deliver in 2025, increasing inventory 1.5%.
  • Fayetteville, NC and Columbia, SC: Two smaller markets, both are expected to add roughly 700 units in 2025.

Source: RealPage