| Data Source: | Data Month: | MOM Change: | Annual Change | Data Release: |
| Green Street | Nov 2023 | 1.3% | -12.0% | December |
| MSCI | Nov 2023 | -0.7% | -12.1% | December |
| Average: | 0.3% | -12.1% |
Category: Uncategorized
The U.S. Housing Supply Summarized
One third of U.S. households are renters (45 million units).
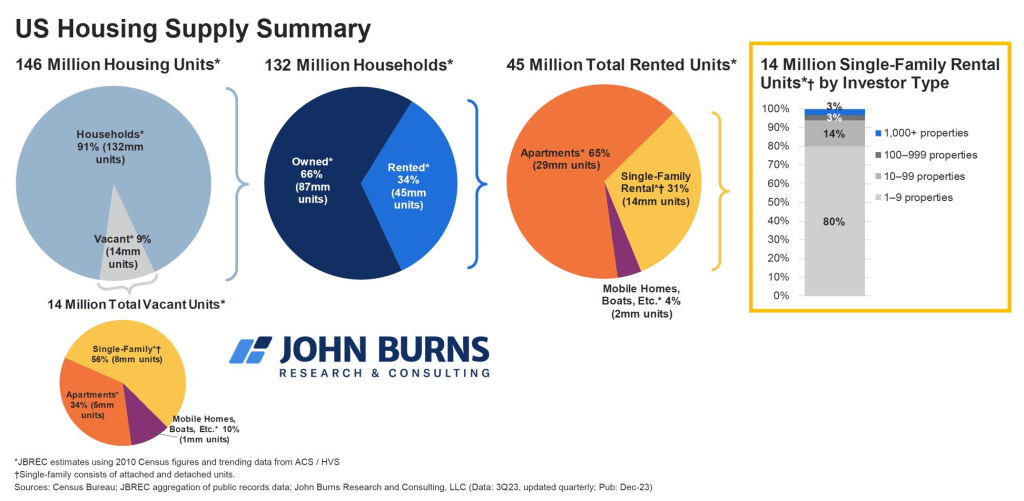
Mom and Pop’s own the majority (80%) of the single-family investment properties:
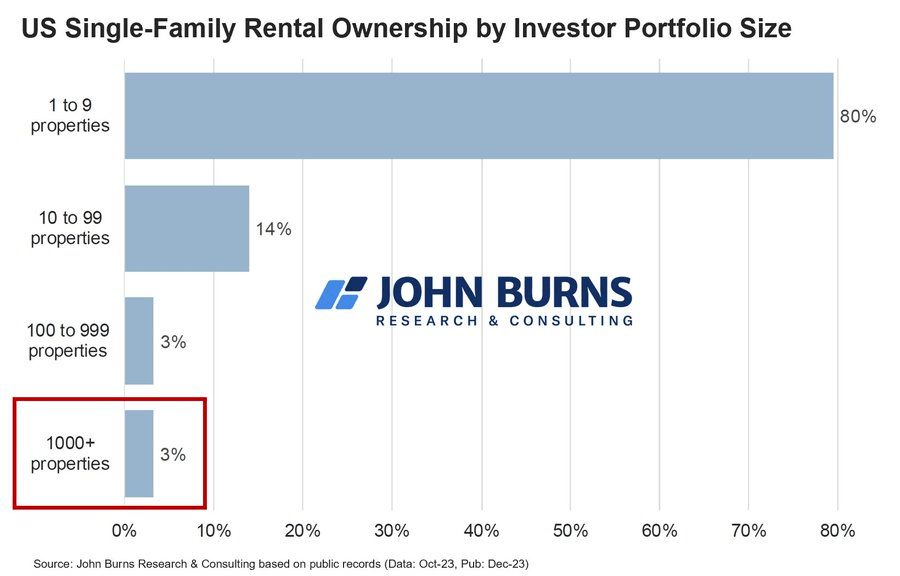
However, there are certain cities where institutional investors own a higher concentration:

Rental Competitiveness Rankings For Cities In The Carolinas & Georgia
RentCafe.com analyzed the 139 largest markets in the U.S. where data was available and ranked them based on five key metrics when it comes to rental competitiveness. These metrics were:
- the number of days apartments stayed vacant
- the percentage of rentals that were occupied
- the number of prospective renters competing for an apartment
- the percentage of renters who renewed their leases
- the share of apartments completed this year
They then used these metrics to calculate a Rental Competitivity Index (RCI) to see how competitive the U.S. rental market was this year.
Here are how the major city/regions ranked in North Carolina, South Carolina and Georgia:
| Market | 2023 Score | Vacant Days | Occupancy: | Prospective Renters | Renewal Rate | % Of New Apts |
| Asheville, NC | 110 | 30 | 95.50% | 12 | 65.50% | 1.30% |
| Fayetteville, NC | 89 | 30 | 94.20% | 9 | 66.00% | 1.71% |
| Columbus, GA | 74 | 32 | 94.00% | 8 | 62.70% | 2.30% |
| Savannah, GA | 69 | 35 | 94.20% | 11 | 58.50% | 2.57% |
| Greenville, NC | 63 | 37 | 93.90% | 6 | 62.20% | 1.38% |
| Greenville, SC | 60 | 35 | 93.30% | 9 | 59.90% | 3.28% |
| The Triangle, NC | 58 | 34 | 93.60% | 8 | 60.70% | 3.80% |
| Columbia, SC | 56 | 36 | 93.00% | 11 | 55.20% | 0.72% |
| Charlotte, NC | 54 | 36 | 93.20% | 9 | 60.50% | 4.19% |
| Macon, GA | 50 | 41 | 92.90% | 9 | 62.10% | 1.68% |
| Suburban Atlanta, GA | 49 | 44 | 92.70% | 8 | 64.40% | 2.88% |
| Athens, GA | 49 | 38 | 92.50% | 8 | 63.60% | 5.16% |
| Charleston, SC | 42 | 37 | 92.80% | 9 | 57.00% | 5.15% |
| Augusta, GA | 39 | 40 | 91.30% | 7 | 63.40% | 5.51% |
| Wilmington, NC | 37 | 37 | 92.30% | 7 | 60.60% | 3.54% |
| Atlanta, GA | 35 | 41 | 91.90% | 9 | 59.30% | 2.07% |
| Piedmont-Triad, NC | 33 | 42 | 92.00% | 8 | 60.30% | 2.86% |
Total Multifamily Debt Crosses $2 Trillion
Delinquencies remain low at Freddie Mac (0.29%), Fannie Mae (0.54%) and banks (0.40%). The trouble is brewing in the $67 billion of CMBS, CDO and ABS loans.
Multifamily debt by lender
| Debt holder | Percentage | Total held |
| Agencies and GSEs | 48% | $986 billion |
| Banks and thrifts | 30% | $606 billion |
| Life insurance companies | 11% | $223 billion |
| State/local governments | 6% | $115 billion |
| CMBS, CDO and ABS | 3% | $67 billion |
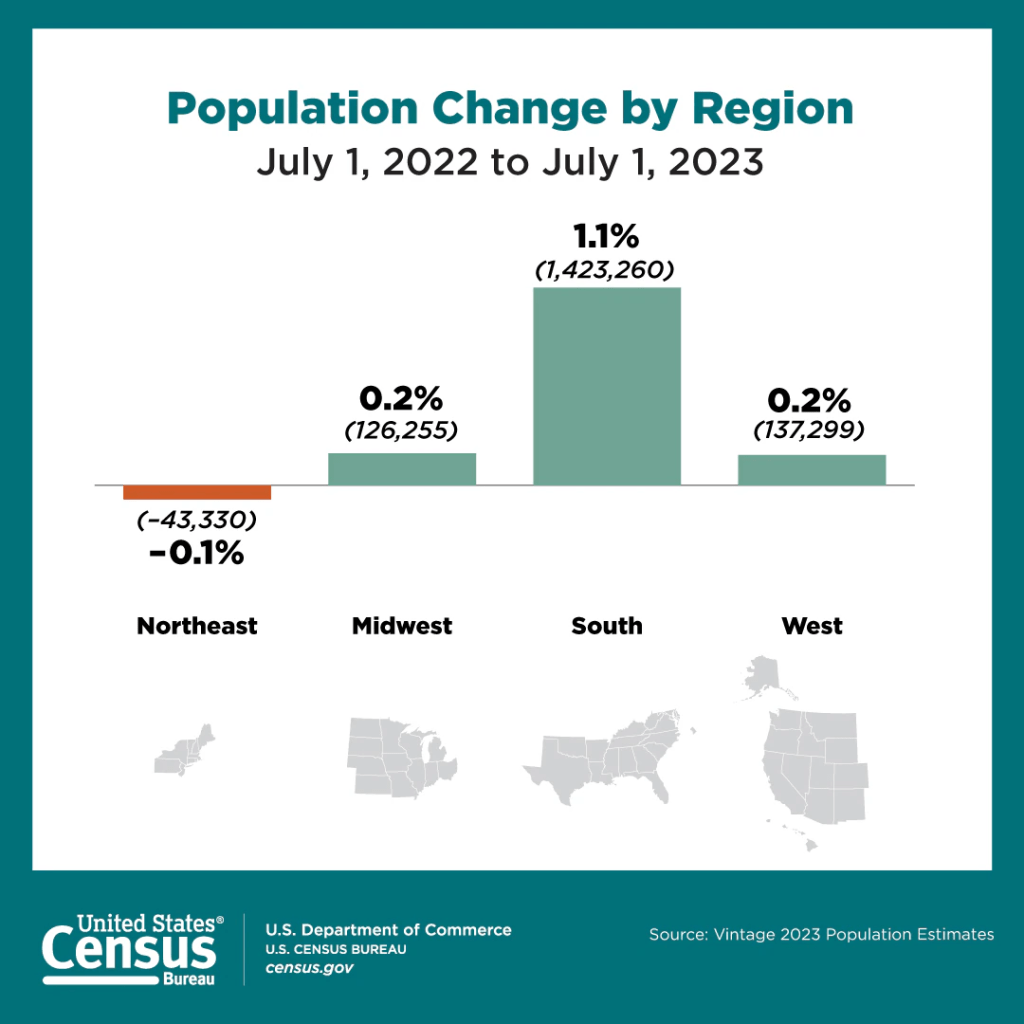
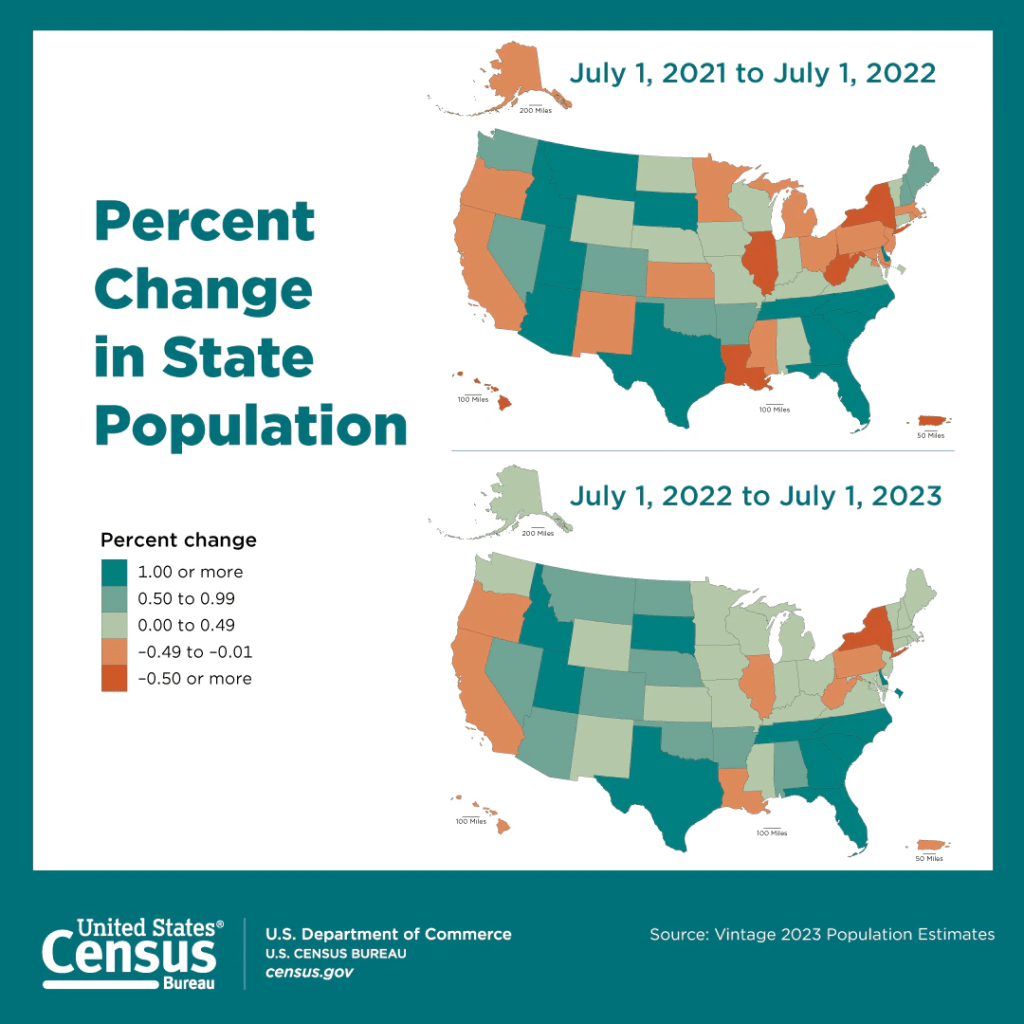
The Southeast Experienced 87% Of The U.S. Population Growth In 2023
The U.S. Census Bureau released their annual population trends data for 2023 yesterday. Americans continue to leave the northeast with the south experiencing the largest inflow of new residents; accounting for 87% of the nation’s growth in 2023.
Top 10 States by Numeric Growth: 2022 to 2023
1. Texas – 473,453
2. Florida – 365,205
3. North Carolina – 139,526
4. Georgia – 116,077
5. South Carolina – 90,600
6. Tennessee – 77,513
7. Arizona – 65,660
8. Virginia – 36,599
9. Colorado – 36,571
10. Utah – 36,498
Top 10 States by Percentage Growth: 2022 to 2023
1. South Carolina – 1.7%
2. Florida – 1.6%
3. Texas – 1.6%
4. Idaho – 1.3%
5. North Carolina – 1.3%
6. Delaware – 1.2%
7. District of Columbia – 1.2%
8. Tennessee – 1.1%
9. Utah – 1.1%
10. Georgia – 1.1%
Multifamily Insurance Up 119% Since 2019
As of November 2023, apartment owners are paying an average of $65 per unit per month ($780 annually), up 119% in the last 4 years. Rates averaged $30 per unit per month ($360 annually) in November 2019.

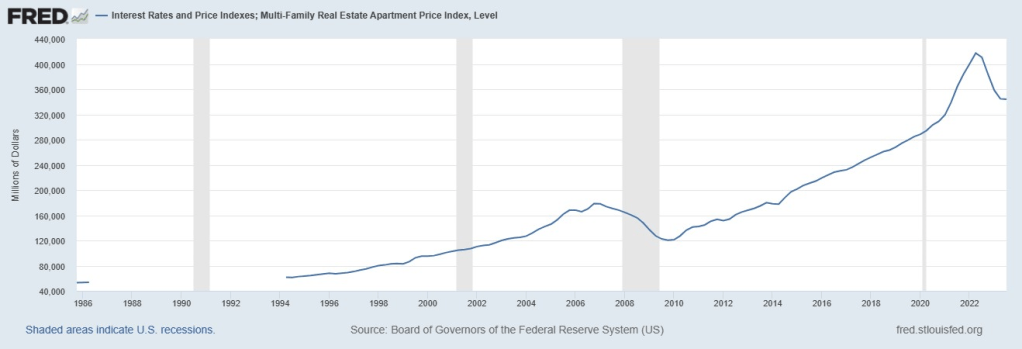
Federal Reserve Updates Multifamily Price Index
The Federal Reserve released multifamily price data through the end of Q3 showing a 2.1% decline quarter-over-quarter and a 16.2% decline year-over-year.
December 2023 National Rent Reports Summarized
Monthly and annual rent changes through November:
| Source: | Month: | Monthly: | Annual: | Vacancy: |
| Apartment List | November | -0.90% | -1.10% | 6.40% |
| CoStar | November | -0.25% | 0.83% | 7.31% |
| Real Page | November | -0.52% | 0.16% | N/A |
| Apartments Advisor | November | -1.83% | -2.83% | N/A |
| Apartments.com | November | -0.30% | 0.80% | N/A |
| Yardi Matrix | November | -0.35% | 0.40% | 5.10% |
| Rent.com | November | -0.57% | -2.09% | N/A |
| Zillow Single Family Homes | November | -0.20% | 3.30% | N/A |
| Zillow Multifamily | November | -0.30% | 2.50% | N/A |
| Redfin | November | -0.60% | -2.10% | N/A |
| Realtor.com | November | -0.69% | -0.60% | N/A |
| Average: | -0.59% | -0.07% | 6.27% |
Record High Percentage Of Student Housing Beds Pre-Leased
28% of fall 2024 student housing beds were pre-leased through November. This is a record high, and it was also the largest October to November increase (17%) in history.
Removing the last two years of record demand, beds are usually about 20% pre-leased by the end of November. A handful of schools (Tennessee, Purdue, Clemson, Arkansas and Wisconsin) have already pre-leased about 2/3 of their privately owned student housing beds.
Asking rents for student housing grew 7% year-over-year through November while many multifamily markets across the country have experienced declines.
Pensford Multifamily Webinar: December 2023
An excellent visual walk-through on interest rates, multifamily debt markets, rate caps and the economy.
