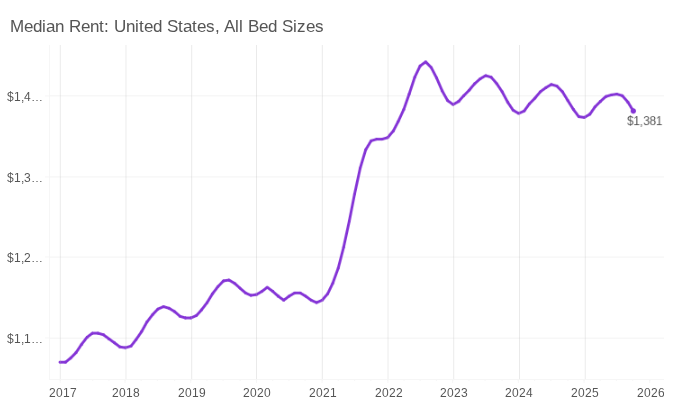
- National apartment rent growth is now projected to decline by 0.1% in the fourth quarter of 2025, a downward revision of 160 basis points from the previous forecast.
- Vacancy will stay at 8.2% through year-end, easing only slightly to 7.9% by the end of 2026.
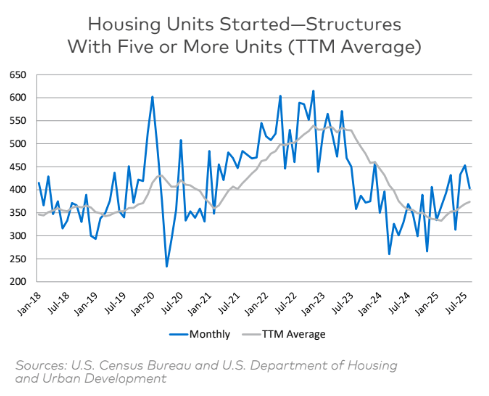
- Demand is losing steam. A weaker labor market, slower household formation, and reduced immigration will likely delay absorption in many oversupplied metros.
- Lower immigration will continue to weigh on employment growth through 2030, putting long-term pressure on rental demand.
- Rents are likely to grow just 1.5% annually over the next five years—below the historical average.
Source: CoStar