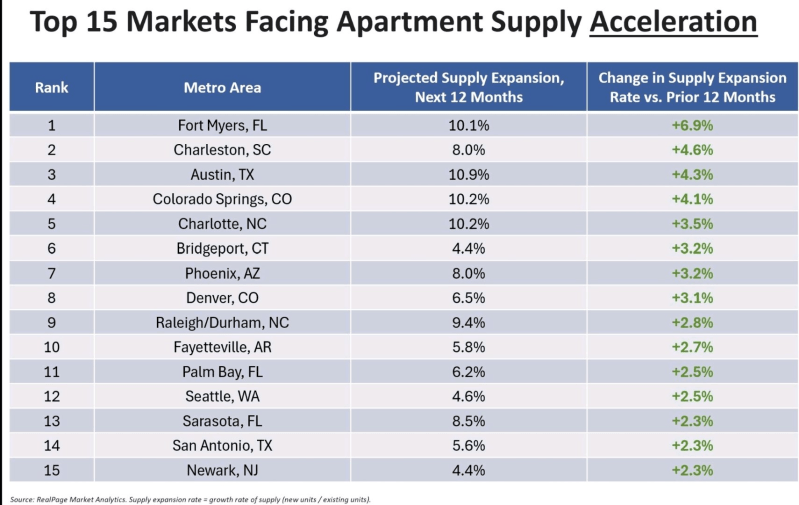
Here are 15 metro areas that will see MORE apartments completed over the next year than they added over the last year. List shows expansion rate of apartment supply (new divided by existing) over the last 12 months, then in green shows the difference between last year’s clip versus next year’s.
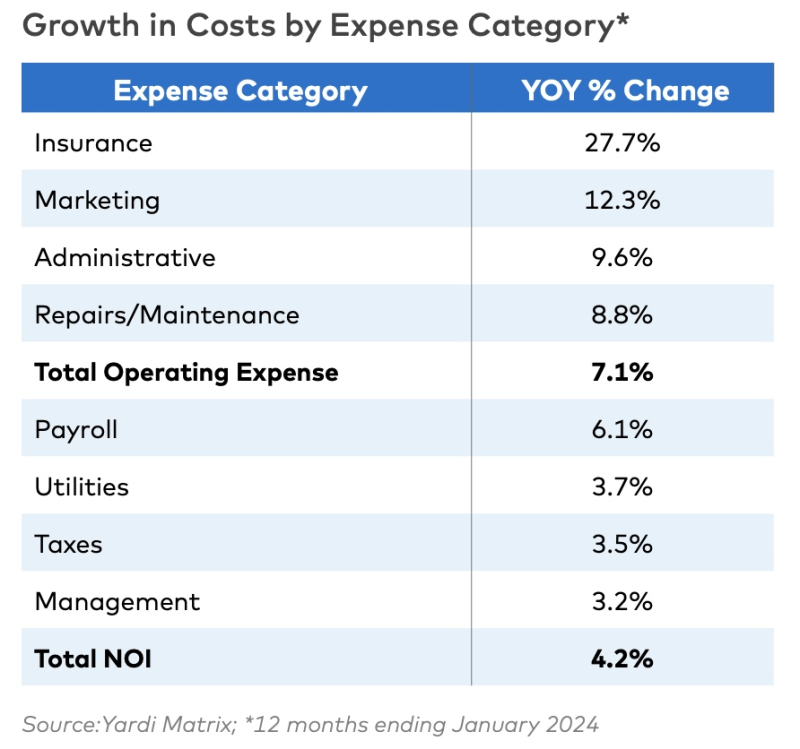
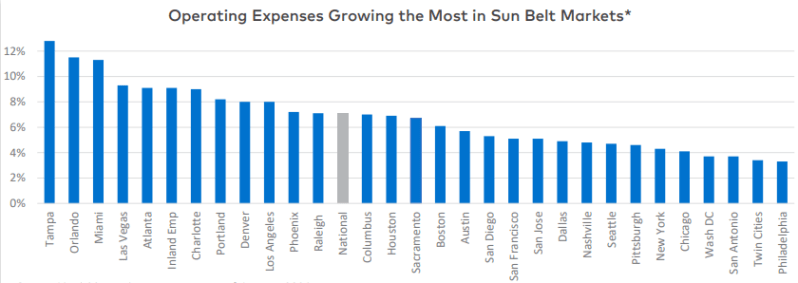
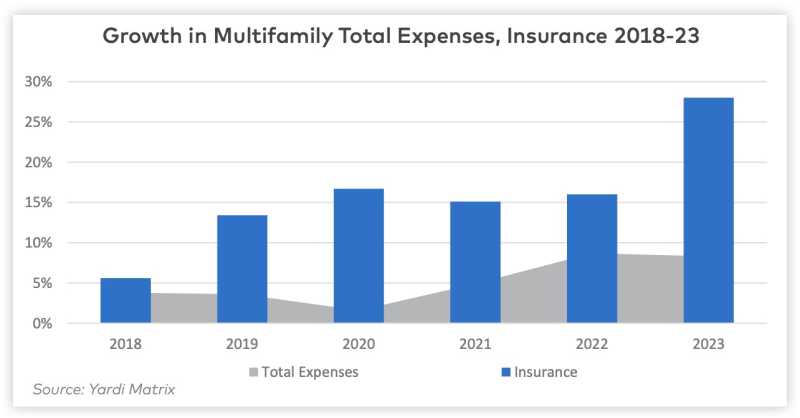
Overall expenses per multifamily units nationally rose by 7.1 percent year-over-year, according to an examination of more than 20,000 properties that use Yardi operating software.
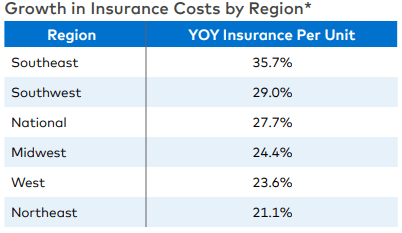
While expense growth remains high but is starting to decelerate, insurance costs climbed in 2023.
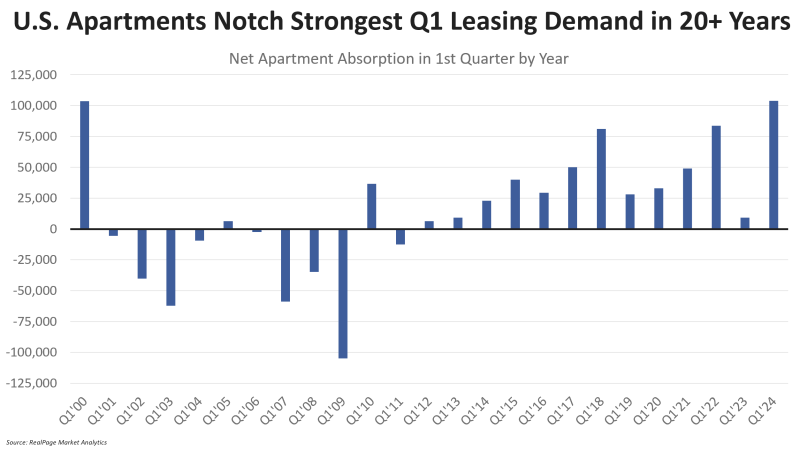
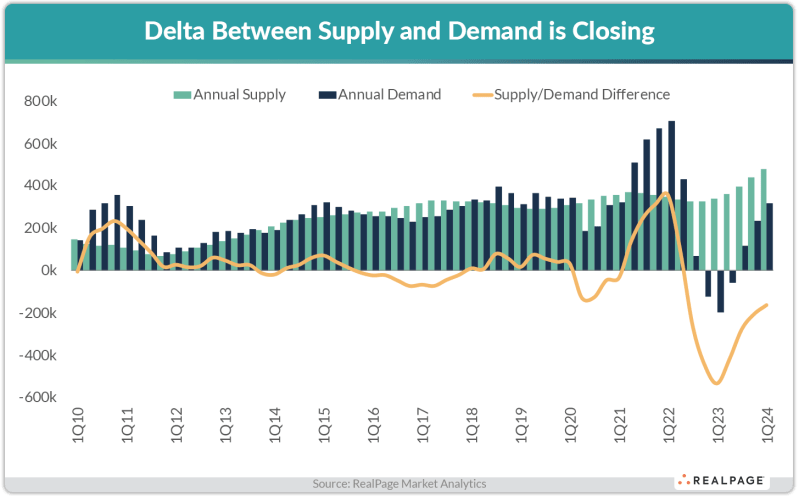
In the first three months of 2024, the U.S. absorbed 103,826 apartment units on net. That rate registered about 20% higher than a typical annual absorption rate from the 2010s decade.
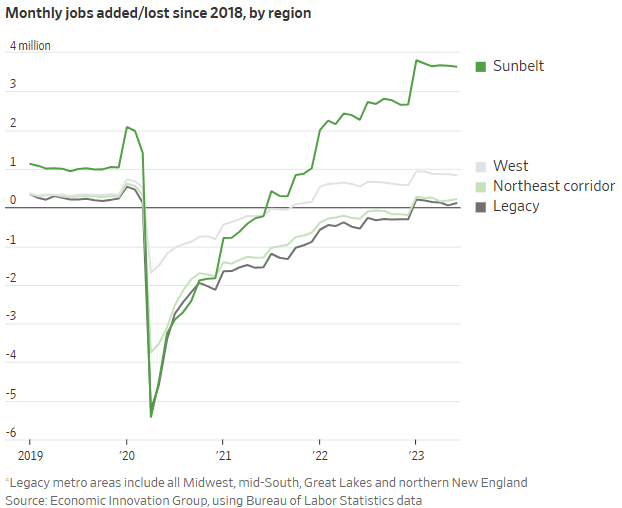
Fueling this demand strength is a confluence of factors, including persistent wage growth (which has now outpaced rent growth for 16 straight months), solid job growth, demographic tailwinds and arguably the lowest level of move-outs from apartment units and into single-family homes since the Great Financial Crisis.
Still, even higher-than-average demand failed to keep pace with nearly unprecedented supply that delivered concurrently. In the first three months of 2024, there were 135,652 apartment units completed nationwide. In total, the U.S. delivered 479,367 new multifamily units in the year-ending 1st quarter 2024, representing a 10% increase from the prior quarter.
The difference between supply and demand narrowed in 1st quarter to its lowest delta since mid-2022. The mismatch between supply and demand shrank to approximately 160,000 units – still a historically high figure, but much lower than the over 530,000-unit delta seen one year ago.
Nearly 75% of people who bought real estate in 2020 and 2021 have regrets about their purchases, with 30% saying they spent too much money. The average cost of home insurance for a $300,000 property in the United States went up 12% in 2023 and is now $1,770 per year.