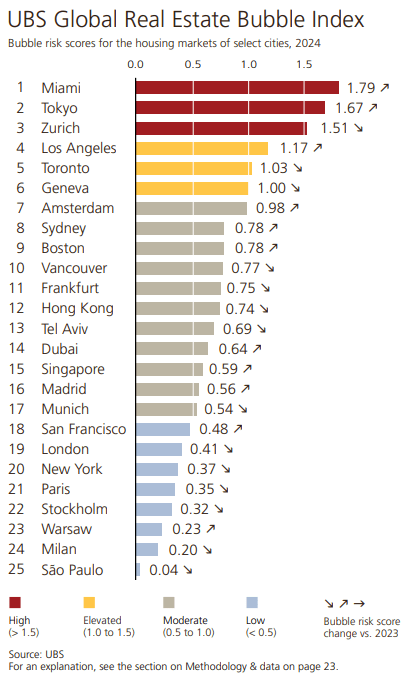
Identifying a bubble: Price bubbles are a recurring phenomenon in property markets. The term “bubble” refers to a substantial and sustained mispricing of an asset, the existence of which cannot be proved unless it bursts. But historical data reveals patterns of property market excesses. Typical signs include a decoupling of prices from local incomes and rents, and imbalances in the real economy, such as excessive lending and construction activity. The UBS Global Real Estate Bubble Index gauges the risk of a property bubble on the basis of such patterns. The index does not predict whether and when a correction will set in. A change in macroeconomic momentum, a shift in investor sentiment, or a major supply increase could trigger a decline in house prices.
The problem with terms like 100-year event or 1,000-year event is that many people hear them and assume they mean another storm of that size shouldn’t occur for another 99 or 999 years. That’s a reasonable conclusion, but it’s incorrect. Each storm is an individual event, so just because one becomes unusually large doesn’t mean that another storm a year later can’t exceed the odds as well.
Imagine you’re rolling a pair of dice. The odds of throwing a pair of sixes is small – just 1 in 36, or slightly less than 3%. But if you roll the dice again, the odds don’t change – they are the same for that roll as the one before.
A more accurate way to communicate storm odds is to think about the annual exceedance probability – the chance that a rainstorm of a given size could occur in any single year. A 1,000-year storm has a 0.1% chance of occurring in any year, and the same probability of occurring again the next year, and the year after.
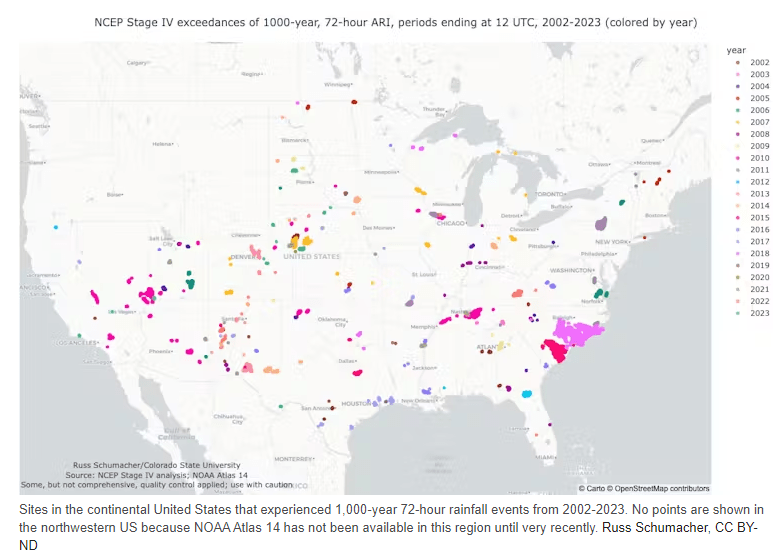
Since the U.S. is a big country, we should expect to see a bunch of 0.1% probability rainstorms every year. The chance of such a storm occurring at any specific location is extremely low, but the chance of one occurring somewhere becomes quite a bit higher.
Put another way, even if you are unlikely to experience a 1,000-year storm at your location, there likely will be 1,000-year storms somewhere in the country every year.
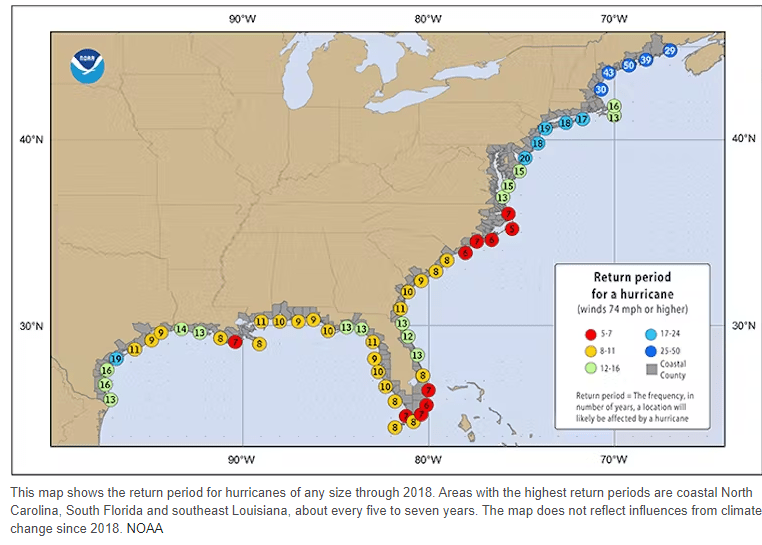
Why have so many storms that, historically and statistically, should be exceedingly rare, struck the Carolinas in just a few years? There are two main reasons, which are related.
First, estimating the probability of rare events requires increasingly large amounts of data. NOAA’s Atlas 14 was last updated for the Carolinas in 2006, and those calculations only used data through 2000.
As more storms occur and more data is collected, the estimates get more robust. Given that reliable rainfall measurements only extend back about 100 years, the true probability of this much rain in the Carolinas may have been underestimated up until now.
Second, these statistics assume the climate isn’t changing, but we know that it is. Especially in regions near the coasts, the frequency of heavy rainfall has increased as a result of human-caused climate change. Warmer air can hold more moisture, and warmer oceans provide that moisture as the fuel for heavy rainfall.
As a result, climate change is making rainstorms that had been extremely rare now somewhat more likely. While the Carolinas may have been especially unlucky in recent years, the dice are also becoming loaded toward heavier rain – a trend that poses major challenges for emergency preparedness and recovery.
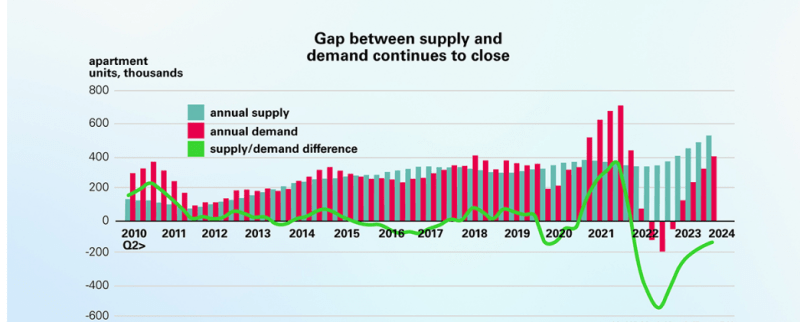
Absorption rates have notably risen from 118,000 units in the first quarter to 166,000 in the second. However, 189,000 new units were delivered, leading to a slight increase in the vacancy rate to 7.9 percent by the end of the second quarter, up from a low of 4.8 percent in the third quarter of 2021. The vacancy rate is anticipated to peak at 8.1 percent in early 2025 before declining.
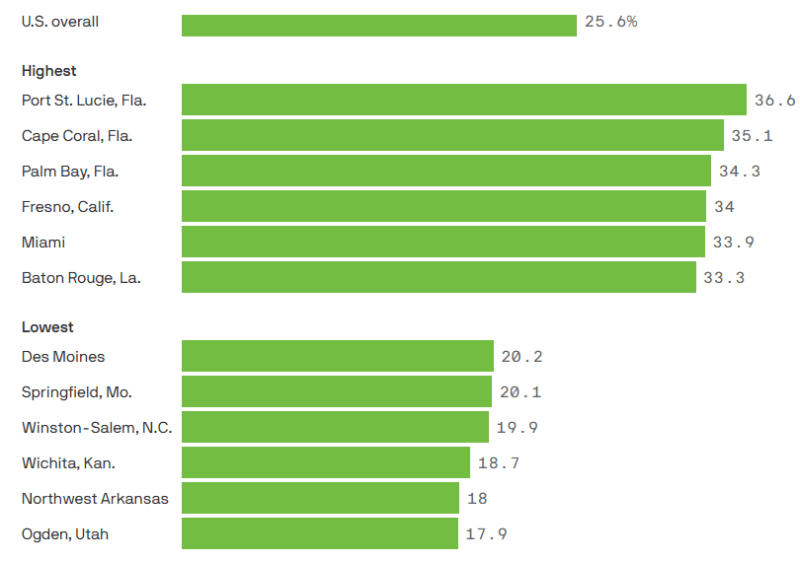
Just over a quarter (25.6%) of U.S. renters are spending more than half their income on housing, according to Census data out this month. The real median gross cost of renting — that’s rent plus utility/energy costs — grew faster annually (+3.8%) than real median home values (+1.8%) last year for the first time in a decade.
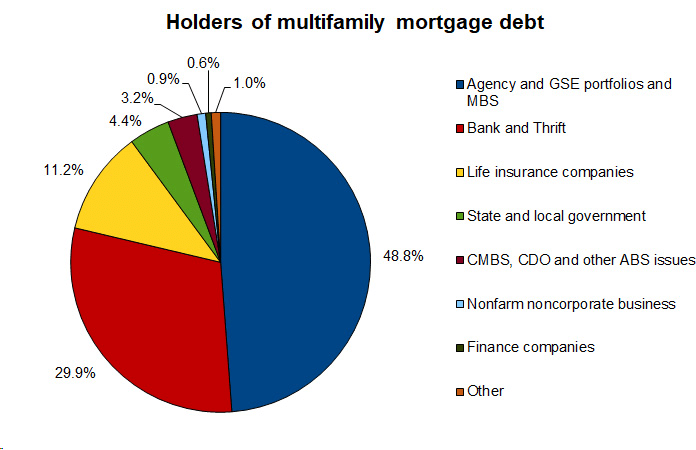
The chart below shows the multifamily debt held by various classes of suppliers as of Q2 2024. It’s important to keep this data in mind when you see a headline that says something like “3% of CMBS loans are now in default.” Those loans in default represent about 0.30% of the total multifamily debt outstanding.
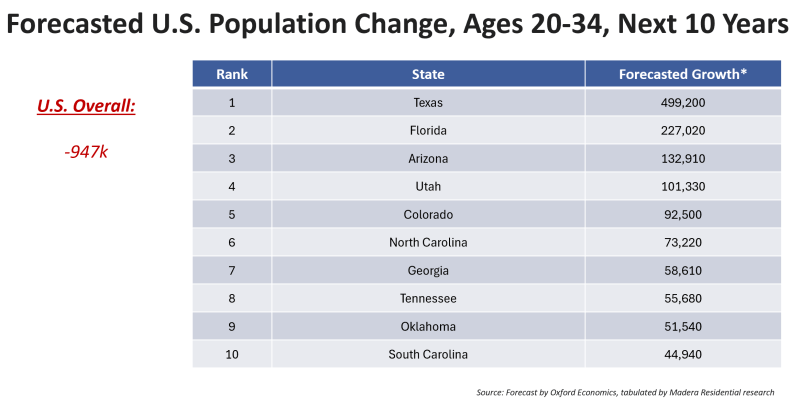
Oxford Economics forecasts that the U.S. population of adults ages 20-34 (prime apartment renter demographic) will decline by 947k people over the next 10 years.
However, these 10 states are still projected to see substantial growth, with North and South Carolina making the list.