Multifamily Trends Entering 2024

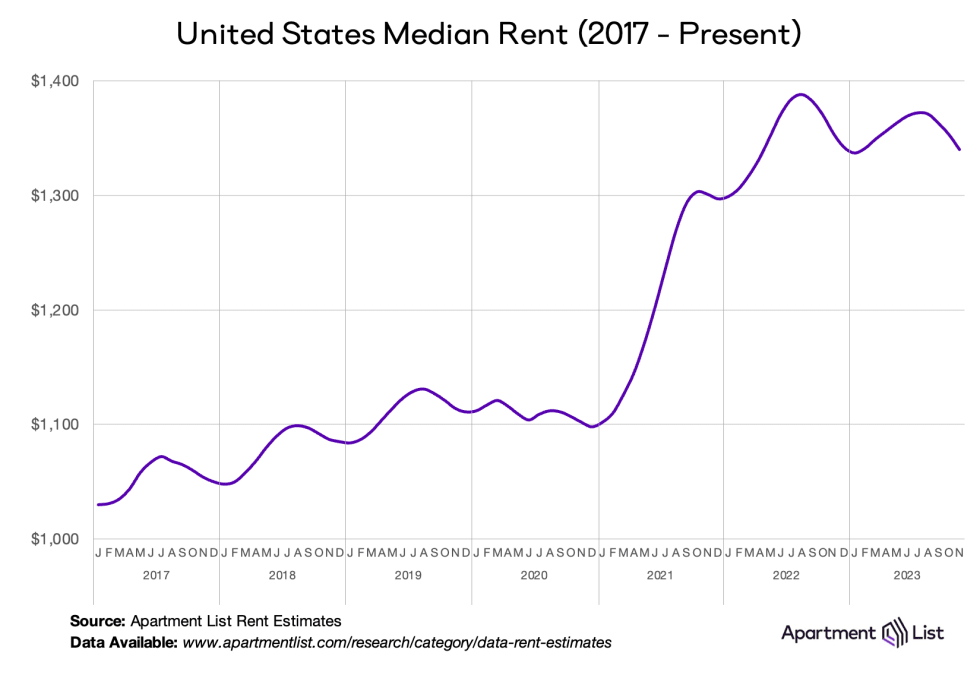
U.S. rents are still digesting the incredible rise during 2021 and the first half of 2022. Rents are below their peak in many markets across the country and continue to fall month-over-month, especially when concessions are taken into account.
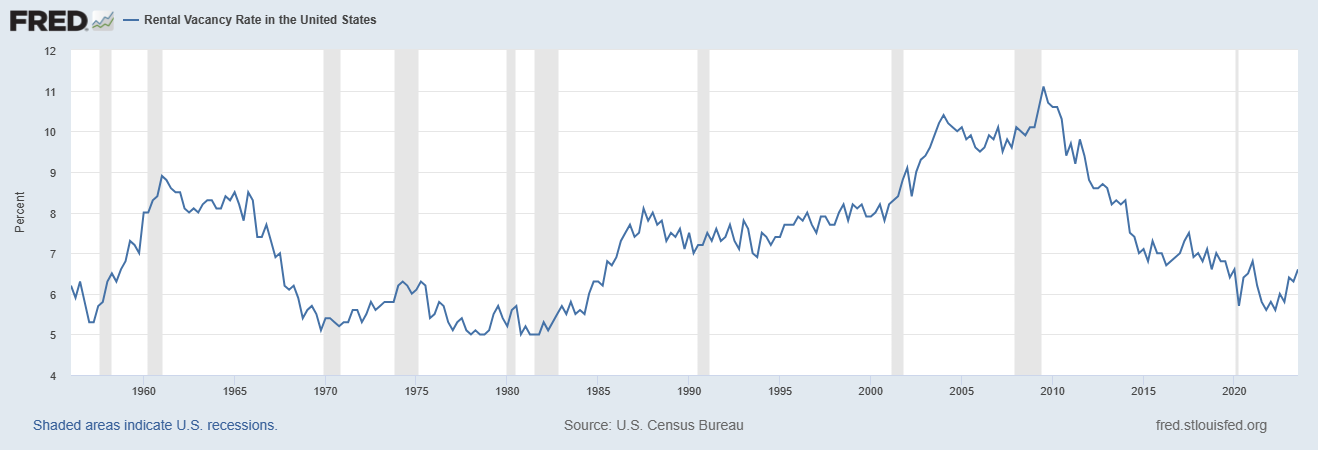
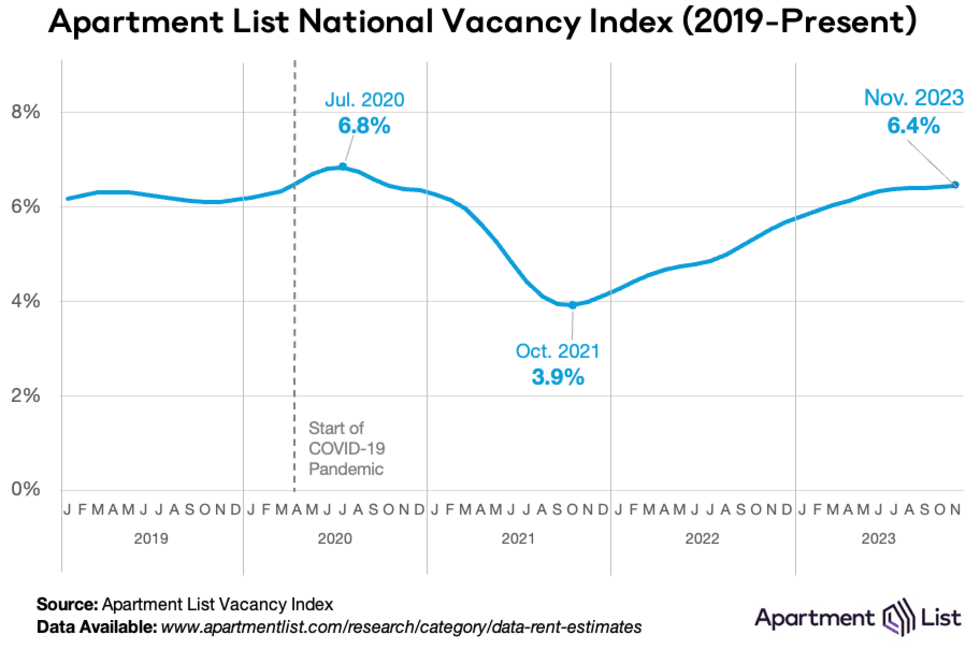
Vacancy rates are back to pre-pandemic levels:
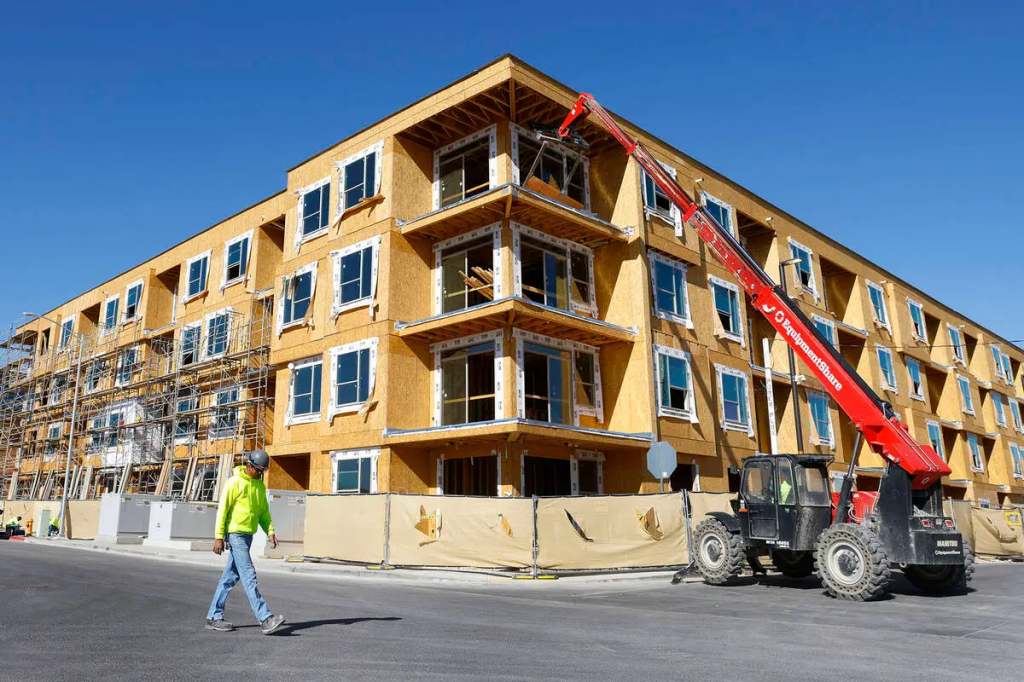
One million apartments are currently under construction with new deliveries set to surge throughout 2024 before starting to decline in the second quarter of 2025:

The sun belt is faced with an enormous supply surge. These are high population growth markets, but they have experienced some of the largest rent declines in the country over the last year.
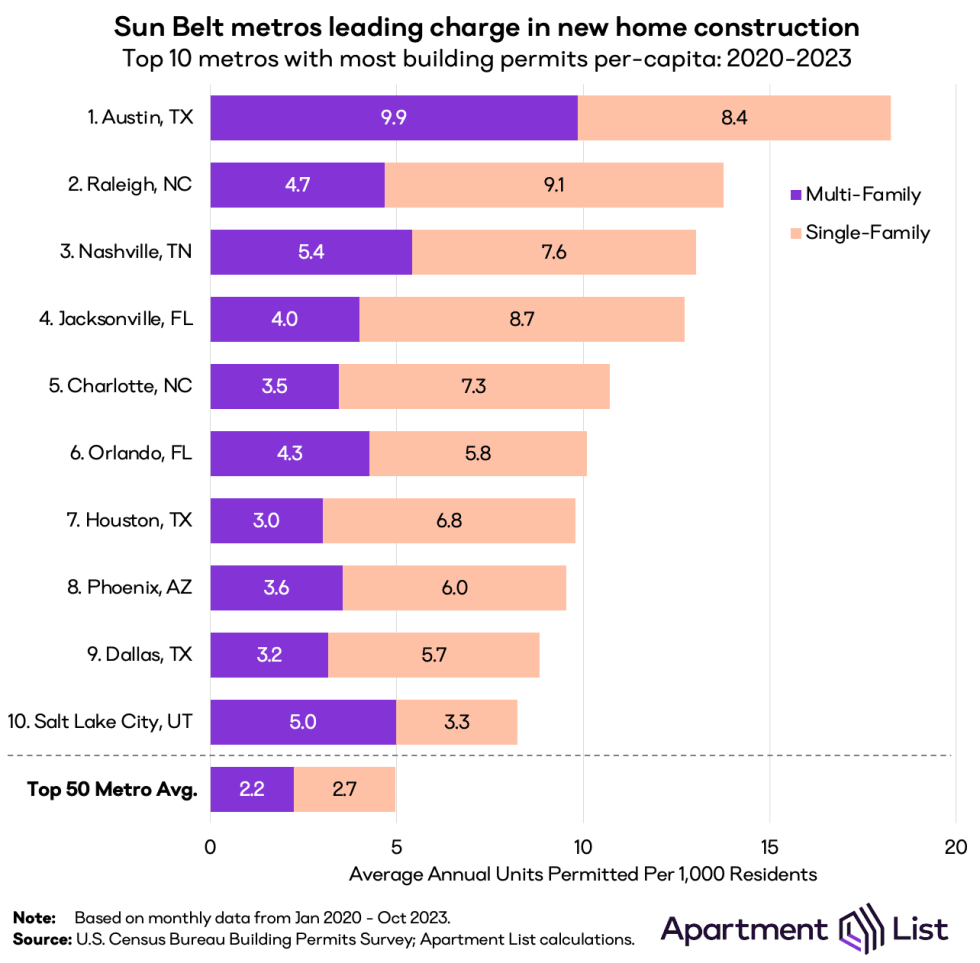
Source: Apartment List

Lease Concessions Are Negatively Impacting Class B Properties

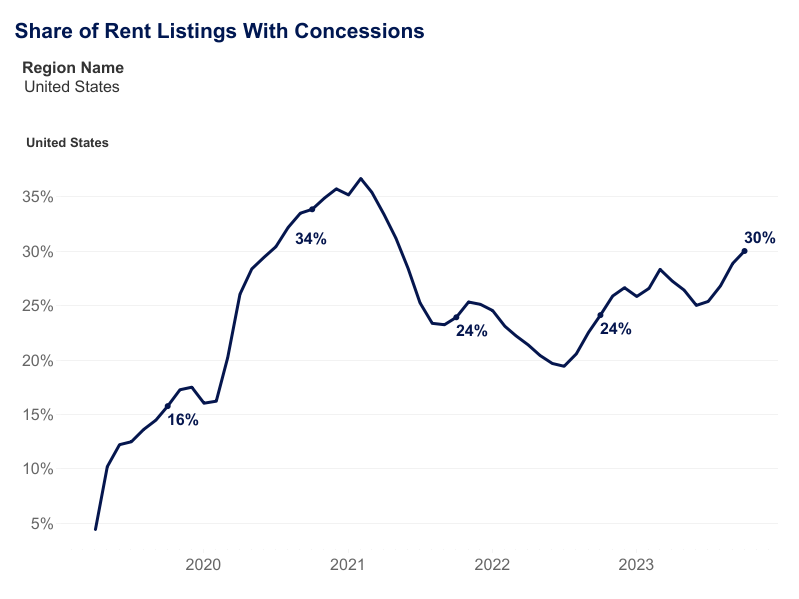
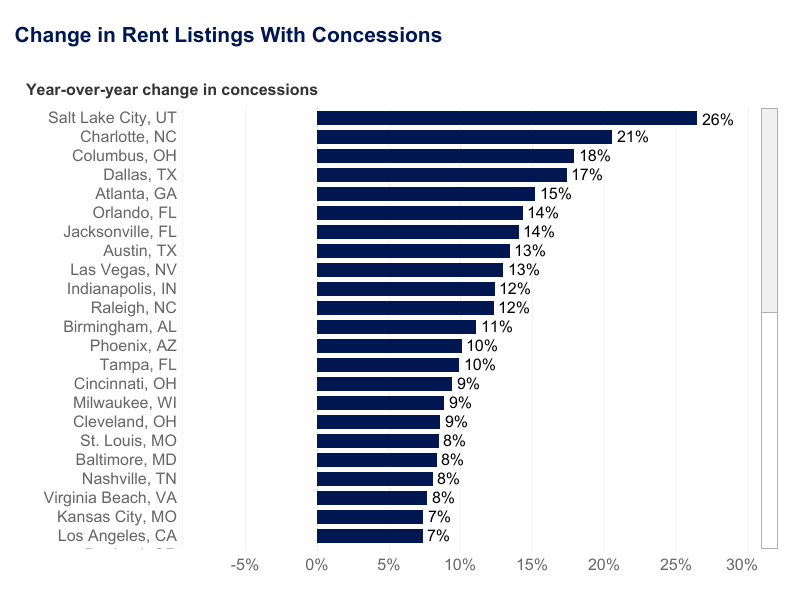
Multifamily REIT CEOs have been commenting on earnings calls that the concessions (1 to 3 months of free rent) from class A buildings are now putting downward pressure on their class B property rents. This is not something they were experiencing in the first half of 2023. Many renters can now afford to move up to a class A community with these concessions in place (3 months of free rent is equivalent to a 25% drop in rents).

When the 10-year treasury hit 5% in October, builders suddenly felt pressure to hit 90% occupancy by year end to try and sell or put permanent financing on their buildings. This is creating a fire sale with rent concessions.

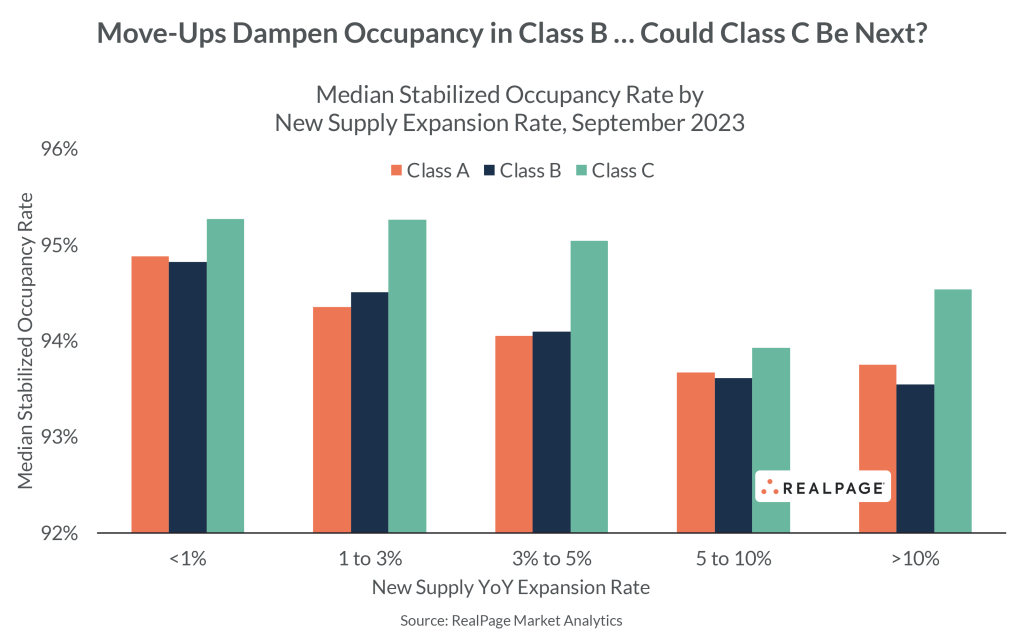
The greater the percentage of new supply relative to the current inventory of apartments in a city, the larger the impact on class B and C properties:

Source: Multifamily Dive and Real Page

November 2023 National Rent Reports Summarized

Monthly and annual rent changes through October:

Source:Month:Monthly Change:Annual Change:Vacancy:Data Release:
Apartment ListOct-0.70%-1.20%6.40%10.30.23
Apartments AdvisorOct-0.52%-0.48%N/A11.1.23
CoStarOct-0.47%0.74%7.15%11.1.23
Apartments.comOct-0.40%0.70%N/A11.7.23
RedfinOct-1.60%-0.30%N/A11.8.23
ZillowOct-0.10%3.20%N/A11.8.23
Yardi MatrixOct-0.20%-0.40%5.10%11.16.23
Rent.comOct-1.64%-0.29%N/A11.20.23
Realtor.comOct-1.03%-0.35%N/A11.28.23
Average:-0.74%0.18%6.22%

Home Price Index Reaches New Record High

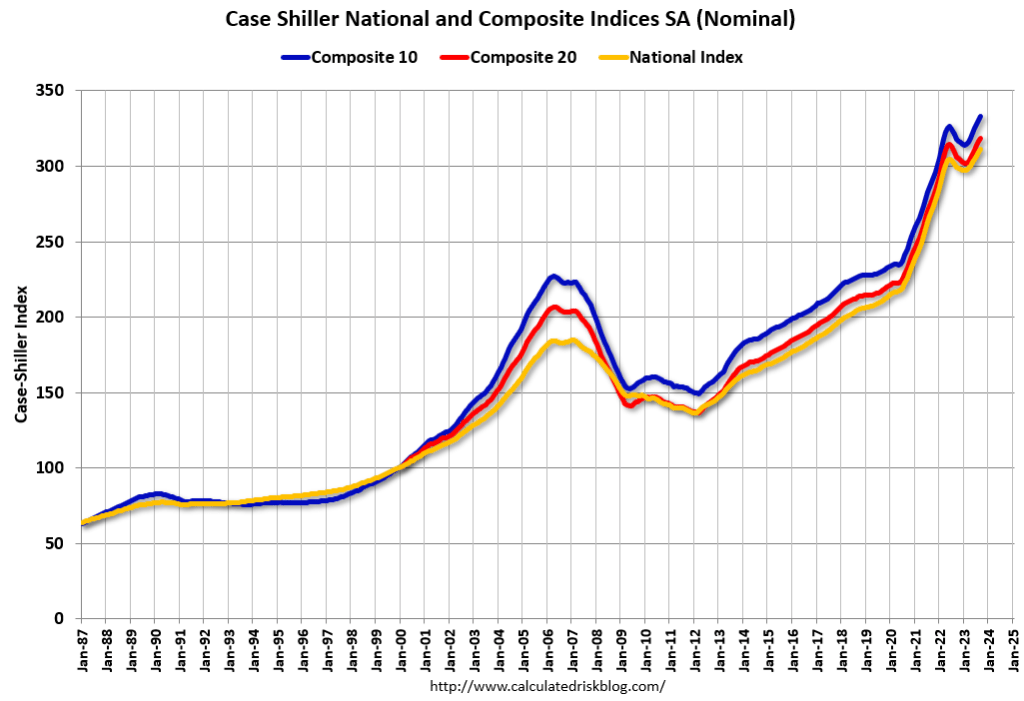
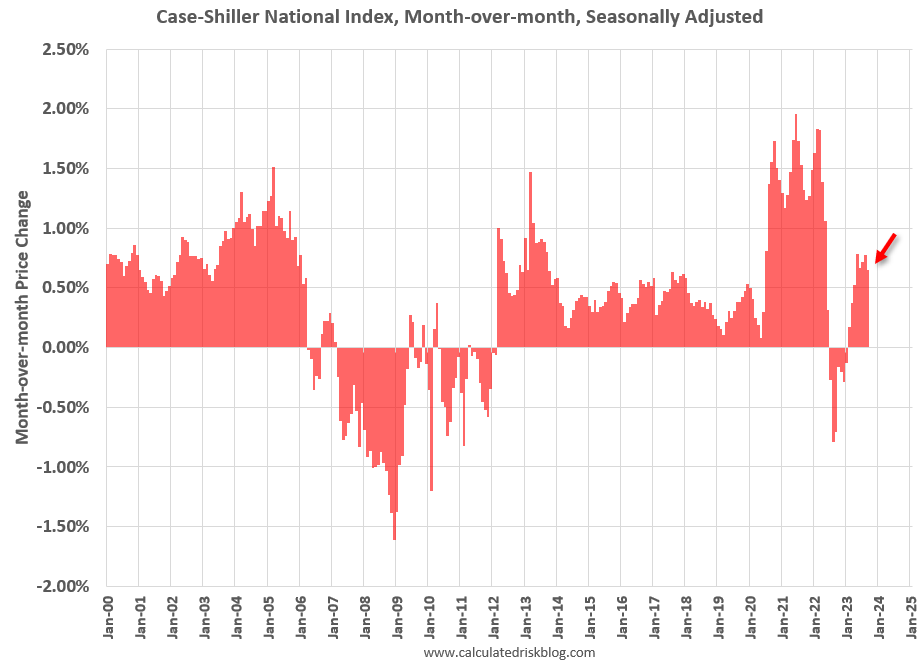
The S&P CoreLogic Case-Shiller U.S. National Home Price NSA Index, covering all nine U.S. census divisions, reported a 3.9% annual change in September (which is an average of July, August and September closing prices), up from a 2.5% change in the previous month.

The month over month increase was at 0.65%. This was the eighth consecutive month-over-month increase following seven straight month-over -month decreases.

Source: Calculated Risk

Fannie & Freddie Receive Lending Limits For 2024

They will each be capped at $70 billion, however, workforce housing will be exempt from their lending limits.

Workforce housing is defined as developments that adhere to state or local housing affordability initiatives for at least 10 years of the loan term. In regions that aren’t cost-burdened, the threshold for affordability is 80% of the area median income or below. Cost-burdened markets can qualify with rents at 100% of AMI, with some up to 120%. Only 18.6% of their loans fit within those income limits in 2022.

Fannie and Freddie have $75 billion in loan limits in 2023, and they were only at $32 billion and $41 billion at the end of Q3.

Full Article At BisNow