One third of U.S. households are renters (45 million units).
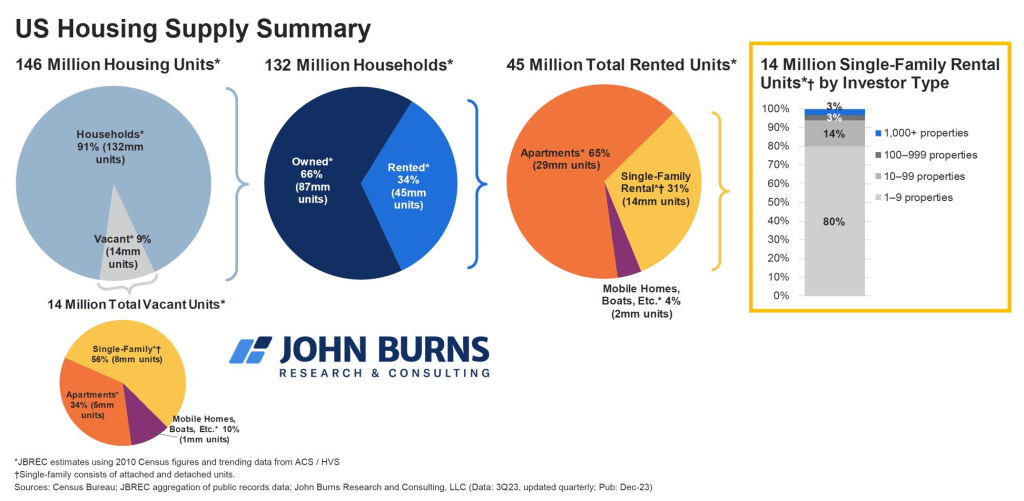
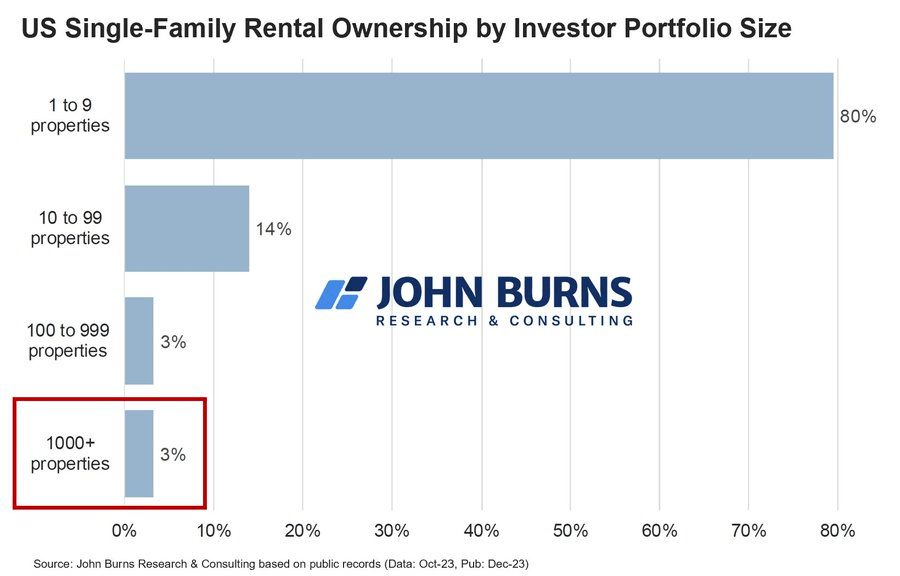
Mom and Pop’s own the majority (80%) of the single-family investment properties:
However, there are certain cities where institutional investors own a higher concentration:

One third of U.S. households are renters (45 million units).
Mom and Pop’s own the majority (80%) of the single-family investment properties:
However, there are certain cities where institutional investors own a higher concentration:
RentCafe.com analyzed the 139 largest markets in the U.S. where data was available and ranked them based on five key metrics when it comes to rental competitiveness. These metrics were:
They then used these metrics to calculate a Rental Competitivity Index (RCI) to see how competitive the U.S. rental market was this year.
Here are how the major city/regions ranked in North Carolina, South Carolina and Georgia:
| Market | 2023 Score | Vacant Days | Occupancy: | Prospective Renters | Renewal Rate | % Of New Apts |
| Asheville, NC | 110 | 30 | 95.50% | 12 | 65.50% | 1.30% |
| Fayetteville, NC | 89 | 30 | 94.20% | 9 | 66.00% | 1.71% |
| Columbus, GA | 74 | 32 | 94.00% | 8 | 62.70% | 2.30% |
| Savannah, GA | 69 | 35 | 94.20% | 11 | 58.50% | 2.57% |
| Greenville, NC | 63 | 37 | 93.90% | 6 | 62.20% | 1.38% |
| Greenville, SC | 60 | 35 | 93.30% | 9 | 59.90% | 3.28% |
| The Triangle, NC | 58 | 34 | 93.60% | 8 | 60.70% | 3.80% |
| Columbia, SC | 56 | 36 | 93.00% | 11 | 55.20% | 0.72% |
| Charlotte, NC | 54 | 36 | 93.20% | 9 | 60.50% | 4.19% |
| Macon, GA | 50 | 41 | 92.90% | 9 | 62.10% | 1.68% |
| Suburban Atlanta, GA | 49 | 44 | 92.70% | 8 | 64.40% | 2.88% |
| Athens, GA | 49 | 38 | 92.50% | 8 | 63.60% | 5.16% |
| Charleston, SC | 42 | 37 | 92.80% | 9 | 57.00% | 5.15% |
| Augusta, GA | 39 | 40 | 91.30% | 7 | 63.40% | 5.51% |
| Wilmington, NC | 37 | 37 | 92.30% | 7 | 60.60% | 3.54% |
| Atlanta, GA | 35 | 41 | 91.90% | 9 | 59.30% | 2.07% |
| Piedmont-Triad, NC | 33 | 42 | 92.00% | 8 | 60.30% | 2.86% |
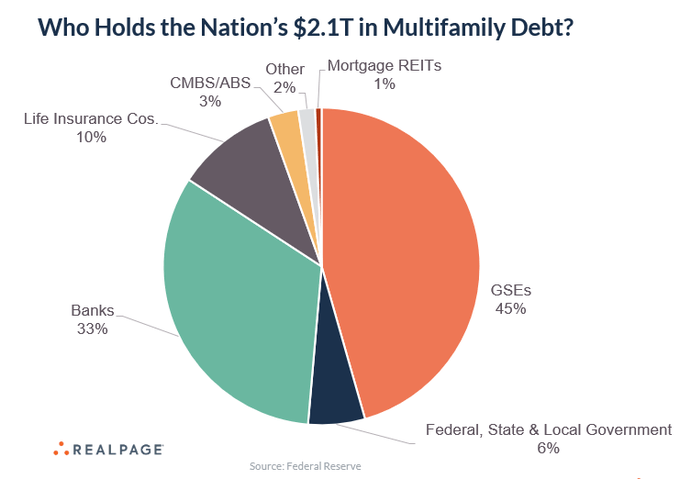
Delinquencies remain low at Freddie Mac (0.29%), Fannie Mae (0.54%) and banks (0.40%). The trouble is brewing in the $67 billion of CMBS, CDO and ABS loans.
| Debt holder | Percentage | Total held |
| Agencies and GSEs | 48% | $986 billion |
| Banks and thrifts | 30% | $606 billion |
| Life insurance companies | 11% | $223 billion |
| State/local governments | 6% | $115 billion |
| CMBS, CDO and ABS | 3% | $67 billion |
The U.S. Census Bureau released their annual population trends data for 2023 yesterday. Americans continue to leave the northeast with the south experiencing the largest inflow of new residents; accounting for 87% of the nation’s growth in 2023.
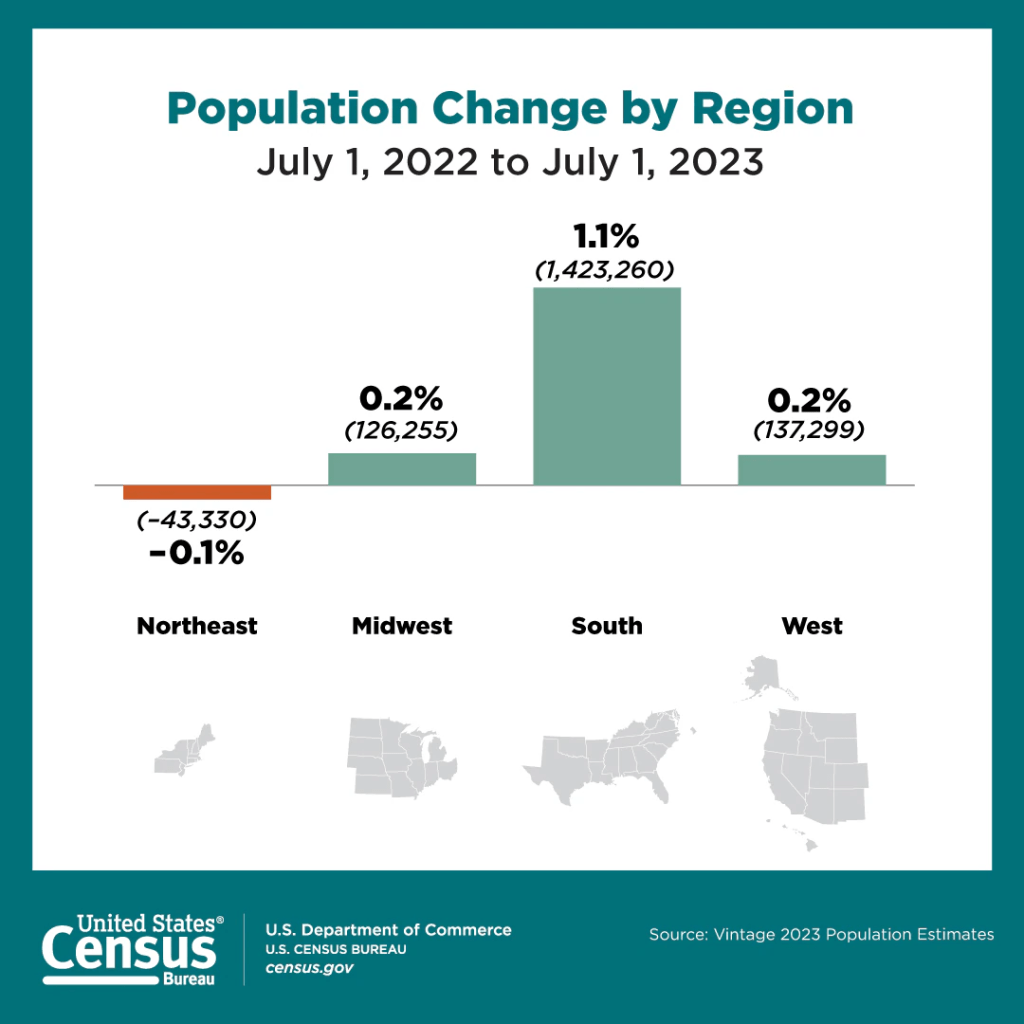
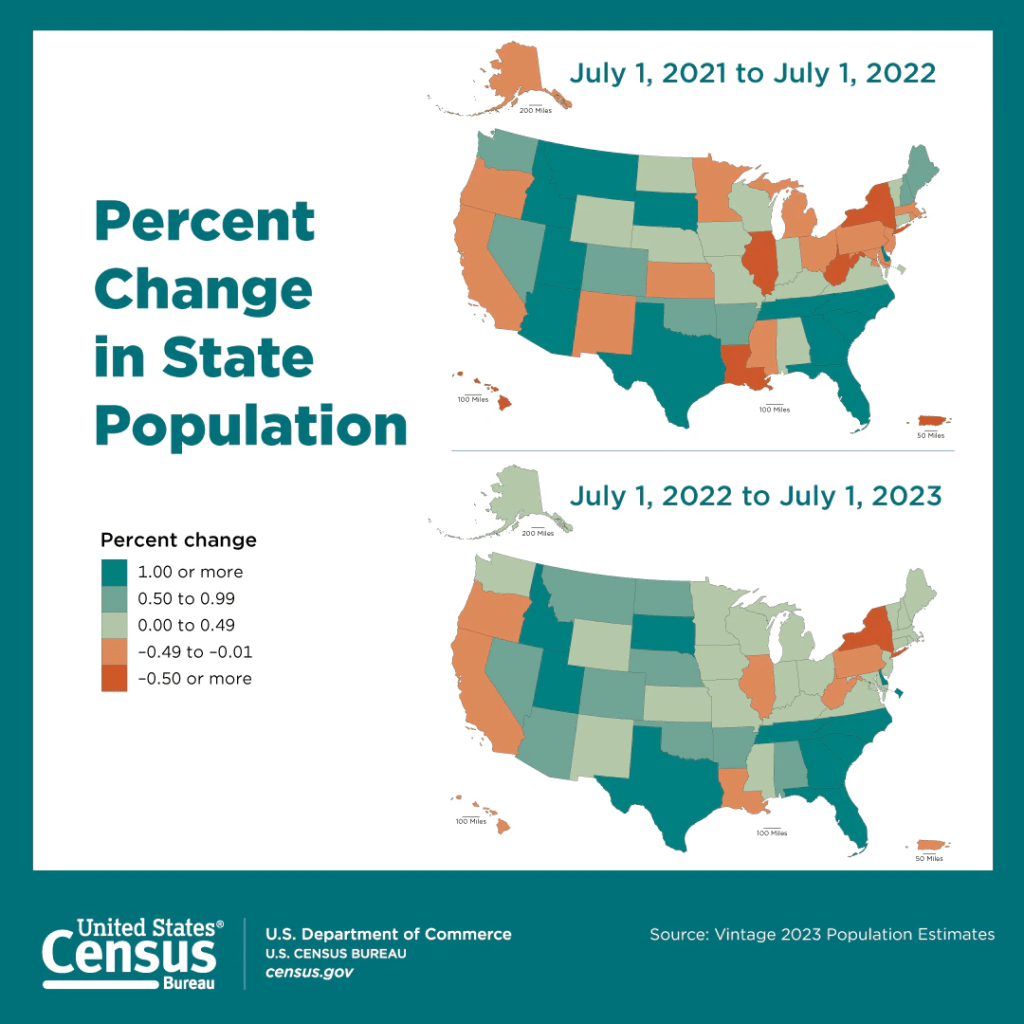
Top 10 States by Numeric Growth: 2022 to 2023
1. Texas – 473,453
2. Florida – 365,205
3. North Carolina – 139,526
4. Georgia – 116,077
5. South Carolina – 90,600
6. Tennessee – 77,513
7. Arizona – 65,660
8. Virginia – 36,599
9. Colorado – 36,571
10. Utah – 36,498
Top 10 States by Percentage Growth: 2022 to 2023
1. South Carolina – 1.7%
2. Florida – 1.6%
3. Texas – 1.6%
4. Idaho – 1.3%
5. North Carolina – 1.3%
6. Delaware – 1.2%
7. District of Columbia – 1.2%
8. Tennessee – 1.1%
9. Utah – 1.1%
10. Georgia – 1.1%
As of November 2023, apartment owners are paying an average of $65 per unit per month ($780 annually), up 119% in the last 4 years. Rates averaged $30 per unit per month ($360 annually) in November 2019.

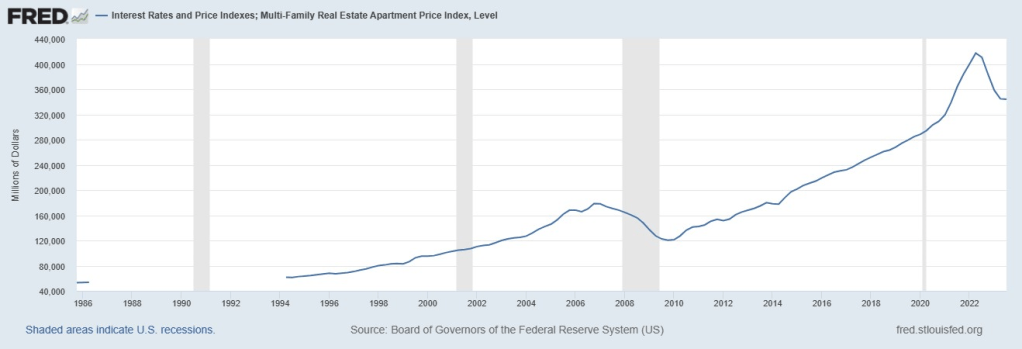
The Federal Reserve released multifamily price data through the end of Q3 showing a 2.1% decline quarter-over-quarter and a 16.2% decline year-over-year.
Monthly and annual rent changes through November:
| Source: | Month: | Monthly: | Annual: | Vacancy: |
| Apartment List | November | -0.90% | -1.10% | 6.40% |
| CoStar | November | -0.25% | 0.83% | 7.31% |
| Real Page | November | -0.52% | 0.16% | N/A |
| Apartments Advisor | November | -1.83% | -2.83% | N/A |
| Apartments.com | November | -0.30% | 0.80% | N/A |
| Yardi Matrix | November | -0.35% | 0.40% | 5.10% |
| Rent.com | November | -0.57% | -2.09% | N/A |
| Zillow Single Family Homes | November | -0.20% | 3.30% | N/A |
| Zillow Multifamily | November | -0.30% | 2.50% | N/A |
| Redfin | November | -0.60% | -2.10% | N/A |
| Realtor.com | November | -0.69% | -0.60% | N/A |
| Average: | -0.59% | -0.07% | 6.27% |
28% of fall 2024 student housing beds were pre-leased through November. This is a record high, and it was also the largest October to November increase (17%) in history.
Removing the last two years of record demand, beds are usually about 20% pre-leased by the end of November. A handful of schools (Tennessee, Purdue, Clemson, Arkansas and Wisconsin) have already pre-leased about 2/3 of their privately owned student housing beds.
Asking rents for student housing grew 7% year-over-year through November while many multifamily markets across the country have experienced declines.
An excellent visual walk-through on interest rates, multifamily debt markets, rate caps and the economy.
Debt funds and CMBS are getting all the headlines for at-risk loans, but together they represent less than 5% of the $2.1 trillion in multifamily debt. The majority of the riskiest bridge loans were concentrated within debt funds, which represent only $42 billion of the total pie.
Delinquency rates at banks (0.40%), Freddie Mac (0.29%) and Fannie Mae (0.54%) remain extremely low (so far).