The delta exists even when looking at only starter homes:
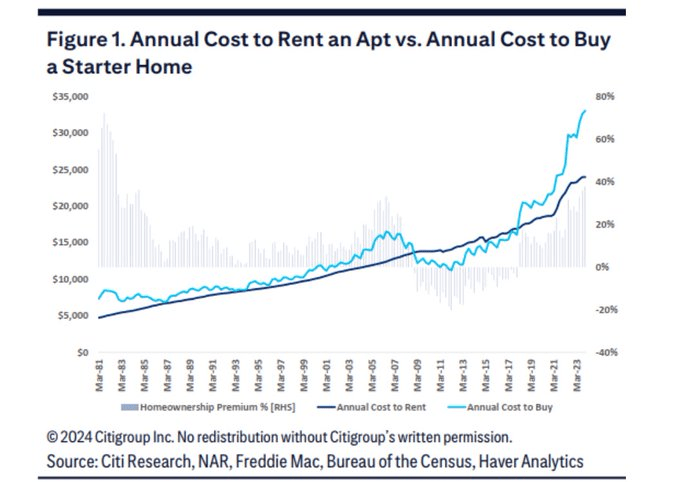
The delta exists even when looking at only starter homes:
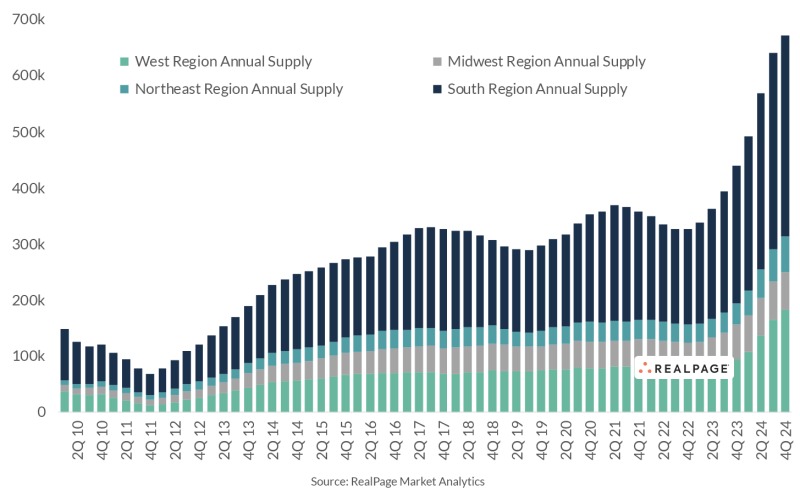
There were 440,000 multifamily units delivered in 2023 with 670,000 expected in 2024. This is the year when the new supply relative to current inventory will rocket higher:
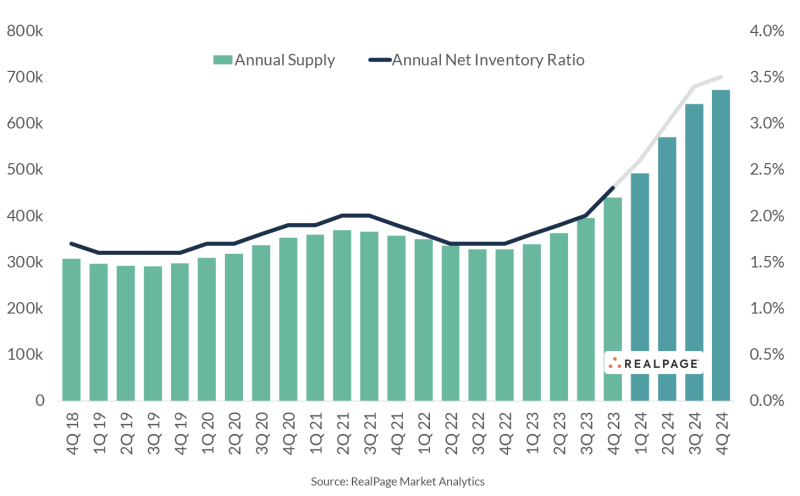
The south region is contributing over 50% of the new supply:
The major supply markets of 2023 will experience a tidal wave in 2024:
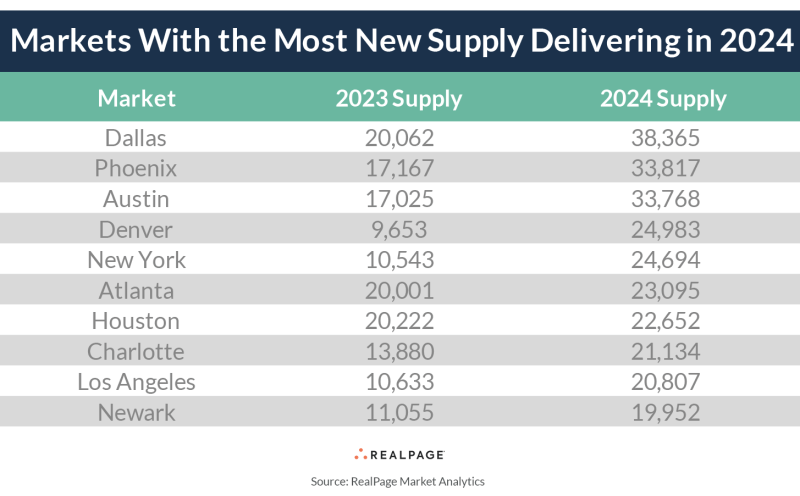
The following are the top 20 markets for new supply in 2023 relative to the size of their current inventory. All 20 of these markets were ranked in the top 22 for net absorption (demand). The supply/demand battle will be one to keep a close watch on as we move forward.

48% of Americans don’t own a home (36% rent and 11% live at home with their parents or other family members).
Due to the surge in rental costs over the past few years, about 25% of renters say they can no longer afford to make the payment, and they will have to move in with their family or friends.
For those who are able to remain in their current housing, 21% say they’re dependent on money from their family to do so – especially millennials and Gen Z (31% and 25%, respectively).
From the summer of 2022 to the summer of 2023, the U.S. population grew by 1.6 million people, with 1.4 million of them—almost 87%—in the South, according to U.S. Census Bureau estimates. But Mississippi essentially missed out on that growth. It gained just over 750 residents during the same period.
This October, according to U.S. Bureau of Labor Statistics data, Mississippi’s civilian labor force had shrunk 1.4% from what it was a decade earlier, even as the South’s workforce overall has grown exponentially.
Only about half of the graduates from Mississippi’s public universities work in the state three years after graduation. Many leave for growing metropolitan areas in other parts of the South. The state has had one of the highest poverty rates in the nation for years. About 12.6% of the state’s population under the age of 65 have a disability, compared with 8.9% overall in the U.S.
Troubles in the capital city of Jackson, the largest city, have pushed many to leave the state. Jackson has seen its population decline from 173,500 in 2010 to 146,000 in 2022, according to Census estimates.

U-Haul calculates each state’s net gain (or loss) of one-way equipment from customer transactions in a calendar year. It shows the states people are moving to (highest on the list) and where they are leaving from (lowest on the list). The number in parenthesis is where the state ranked in 2022.
| 1. | TEXAS (1) |
| 2. | FLORIDA (2) |
| 3. | NORTH CAROLINA (4) |
| 4. | SOUTH CAROLINA (3) |
| 5. | TENNESSEE (6) |
| 6. | IDAHO (10) |
| 7. | WASHINGTON (23) |
| 8. | ARIZONA (7) |
| 9. | COLORADO (11) |
| 10. | VIRGINIA (5) |
| 11. | NEVADA (13) |
| 12. | VERMONT (30) |
| 13. | UTAH (12) |
| 14. | WYOMING (33) |
| 15. | DELAWARE (27) |
| 16. | NEW MEXICO (19) |
| 17. | ARKANSAS (43) |
| 18. | GEORGIA (8) |
| 19. | SOUTH DAKOTA (31) |
| 20. | MINNESOTA (17) |
| 21. | MONTANA (18) |
| 22. | ALABAMA (20) |
| 23. | OHIO (9) |
| 24. | IOWA (21) |
| 25. | HAWAII (–) |
| 26. | WISCONSIN (16) |
| 27. | INDIANA (14) |
| 28. | MISSOURI (15) |
| 29. | KENTUCKY (26) |
| 30. | WEST VIRGINIA (25) |
| 31. | MAINE (29) |
| 32. | NORTH DAKOTA (37) |
| 33. | KANSAS (39) |
| 34. | ALASKA (41) |
| 35. | NEBRASKA (32) |
| 36. | RHODE ISLAND (40) |
| 37. | OREGON (22) |
| 38. | PENNSYLVANIA (24) |
| 39. | MISSISSIPPI (34) |
| 40. | NEW HAMPSHIRE (38) |
| 41. | OKLAHOMA (42) |
| 42. | CONNECTICUT (28) |
| 43. | NEW YORK (46) |
| 44. | MARYLAND (44) |
| 45. | LOUISIANA (35) |
| 46. | MICHIGAN (48) |
| 47. | NEW JERSEY (45) |
| 48. | ILLINOIS (49) |
| 49. | MASSACHUSETTS (47) |
| 50. | CALIFORNIA (50) |
Half of all new multifamily supply went to the South in 2023. However, the relative deficits and vacancy spikes (70 – 100 bps) were similar in every region of the country. Why? The South also had the vast majority of the demand, more than all the other regions combined.

The South accounted for 87% of the country’s population growth in 2023, with a net migration of 1.4 million new residents, of which over 700,000 were domestic. The Midwest and West have both seen modest gains, while the Northeast’s population has fallen 0.1%.
| Inbound | Outbound |
|---|---|
| 1. Maine | 1. Illinois |
| 2. North Carolina | 2. Pennsylvania |
| 3. New Hampshire | 3. Louisiana |
| 4. Montana | 4. Minnesota |
| 5. Washington | 5. Indiana |
| 6. Arkansas | 6. Oregon |
| 7. Florida | 7. Iowa |
| 8. New Mexico | 8. Mississippi |
| 9. District of Columbia | 9. New York |
| 10. Texas | 10. Ohio |
The following chart shows the percentage gains (or declines) for home values over a 1, 3 and 12 month period in the Carolinas.
The last column shows the percentage of the median income it takes to make a home payment (principle, interest, taxes and insurance) in that city. It assumes a 5% down payment and 30-year mortgage rates at 6.5%, which is where they were as of this morning.
Historically, borrowers were considered safe if less than 28% of their monthly payment was going to toward the mortgage payment. As of this month, every single city is above 28% with most significantly above, and that is coming off a massive decline in mortgage rates over the last 60 days (they were above 8% at the end of October).
| City | State | Monthly | 3 Month | Annual | % |
| Anderson | SC | 0.07% | -0.06% | 9.50% | 42% |
| Graham | NC | 0.47% | 1.97% | 8.70% | 48% |
| Fayetteville | NC | 0.40% | 1.47% | 8.10% | 38% |
| Jacksonville | NC | 0.58% | 1.66% | 7.90% | 42% |
| New Bern | NC | 0.38% | 1.12% | 7.80% | 42% |
| Tarboro | NC | 1.03% | 2.36% | 7.70% | 29% |
| Charleston | SC | 0.84% | 3.50% | 7.30% | 60% |
| Goldsboro | NC | 0.28% | 0.82% | 7.20% | 40% |
| Oxford | NC | 0.43% | 1.34% | 7.00% | 41% |
| Aberdeen | NC | 0.46% | 1.05% | 6.90% | 38% |
| Sanford | NC | 0.26% | 1.22% | 6.60% | 45% |
| Shelby | NC | -0.83% | -1.62% | 6.60% | 38% |
| Asheboro | NC | 0.51% | 2.38% | 6.40% | 45% |
| Butner | NC | 0.22% | 0.68% | 6.30% | 32% |
| Greenville | NC | 0.28% | 1.31% | 6.20% | 38% |
| Henderson | NC | 0.79% | 1.34% | 6.20% | 34% |
| Lexington | NC | 0.55% | 2.43% | 6.20% | 51% |
| North Charleston | SC | 0.59% | 2.16% | 6.20% | 42% |
| Wilmington | NC | 0.35% | 1.20% | 6.10% | 57% |
| Burlington | NC | 0.43% | 1.65% | 6.00% | 35% |
| Boone | NC | 0.33% | 1.26% | 5.80% | 79% |
| Siler City | NC | 0.13% | 0.63% | 5.80% | 45% |
| Elkin | NC | 0.39% | 1.76% | 5.70% | 36% |
| Rocky Mount | NC | 0.58% | 1.93% | 5.70% | 36% |
| Wilson | NC | 0.24% | 0.81% | 5.70% | 47% |
| Chapel Hill | NC | 0.41% | 2.03% | 5.60% | 61% |
| Elizabeth City | NC | 0.72% | 2.35% | 5.60% | 39% |
| Lenoir | NC | 0.55% | 2.24% | 5.40% | 40% |
| King | NC | 0.52% | 1.81% | 5.30% | 35% |
| Southern Pines | NC | 0.16% | 0.51% | 5.00% | 55% |
| High Point | NC | 0.25% | 1.40% | 4.80% | 38% |
| Morganton | NC | 0.44% | 1.82% | 4.70% | 44% |
| Winston-Salem | NC | 0.60% | 2.43% | 4.70% | 40% |
| Laurinburg | NC | 0.31% | 1.24% | 4.60% | 33% |
| Newport | NC | 0.36% | 0.85% | 4.60% | 44% |
| Waynesville | NC | 0.50% | 40.51% | 4.60% | 56% |
| Hillsborough | NC | 0.49% | 1.88% | 4.50% | 47% |
| Greensboro | NC | 0.31% | 1.34% | 4.40% | 37% |
| Pinehurst | NC | 0.16% | 0.62% | 4.40% | 58% |
| Hickory | NC | 0.42% | 1.35% | 4.20% | 46% |
| Wilkesboro | NC | -0.26% | 0.11% | 4.20% | 49% |
| North Myrtle Beach | SC | 0.62% | 1.34% | 4.20% | 51% |
| Columbia | SC | 0.34% | 1.10% | 4.10% | 37% |
| Lincolnton | NC | 0.35% | 1.77% | 4.00% | 41% |
| Spartanburg | SC | 0.50% | 2.06% | 4.00% | 38% |
| Asheville | NC | 0.59% | 1.95% | 3.90% | 66% |
| Goose Creek | SC | 0.46% | 1.52% | 3.90% | 40% |
| Sumter | SC | 0.02% | 0.32% | 3.80% | 31% |
| Kinston | NC | 0.36% | 0.52% | 3.70% | 32% |
| Lumberton | NC | 0.10% | 0.37% | 3.70% | 34% |
| Pittsboro | NC | 0.16% | 0.66% | 3.60% | 57% |
| Hendersonville | NC | 0.23% | 1.05% | 3.40% | 56% |
| Greenville | SC | 0.44% | 1.14% | 3.40% | 40% |
| Clemmons | NC | 0.29% | 1.12% | 3.20% | 41% |
| Jamestown | NC | 0.10% | 0.67% | 3.20% | 49% |
| Arden | NC | 0.50% | 1.68% | 3.00% | 52% |
| Easley | SC | 0.20% | 0.48% | 3.00% | 41% |
| Creedmoor | NC | 0.18% | 0.80% | 2.70% | 41% |
| Salisbury | NC | 0.37% | 1.24% | 2.40% | 42% |
| Statesville | NC | 0.26% | 1.21% | 2.20% | 45% |
| Carthage | NC | -0.07% | 0.37% | 2.10% | 39% |
| Kernersville | NC | 0.27% | 1.04% | 2.10% | 40% |
| Leland | NC | 0.15% | 0.46% | 2.10% | 50% |
| Florence | SC | 0.54% | 0.86% | 1.90% | 32% |
| Greer | SC | 0.21% | 0.76% | 1.80% | 38% |
| Summerville | SC | 0.28% | 1.01% | 1.80% | 44% |
| Boiling Springs | SC | 0.25% | 1.26% | 1.70% | 41% |
| Duncan | SC | 0.29% | 1.26% | 1.60% | 37% |
| Orangeburg | SC | 0.43% | 0.46% | 1.50% | 42% |
| Apex | NC | 0.25% | 1.10% | 1.40% | 39% |
| Mebane | NC | 0.19% | 1.30% | 1.40% | 43% |
| Simpsonville | SC | 0.11% | 0.50% | 1.40% | 37% |
| Durham | NC | 0.33% | 1.21% | 0.90% | 49% |
| Raleigh | NC | 0.06% | 0.46% | 0.90% | 46% |
| Charlotte | NC | 0.41% | 1.59% | 0.80% | 46% |
| Shallotte | NC | -0.05% | -0.21% | 0.80% | 50% |
| Myrtle Beach | SC | -0.02% | 0.24% | 0.30% | 46% |
| Conway | SC | 0.19% | 0.37% | -0.30% | 50% |
| Lancaster | SC | 0.26% | 0.82% | -0.50% | 50% |
| Morrisville | NC | 0.24% | 0.67% | -1.20% | 37% |
| Clayton | NC | 0.06% | 0.16% | -3.20% | 39% |
| Gaffney | SC | -1.10% | -4.20% | -4.80% | 45% |
| Newberry | SC | 0.16% | -1.05% | -9.00% | 35% |
After a brief decline in November, distress in multifamily CMBS loans U-turned higher again in to finish the year. The chart below shows the percentage of multifamily CMBS loans delinquent, with special servicers or unable to be paid off at maturity (green line).
It’s important to note that CMBS loans make up a small percentage of the multifamily pie, but they provide more transparent information compared to other loan types.
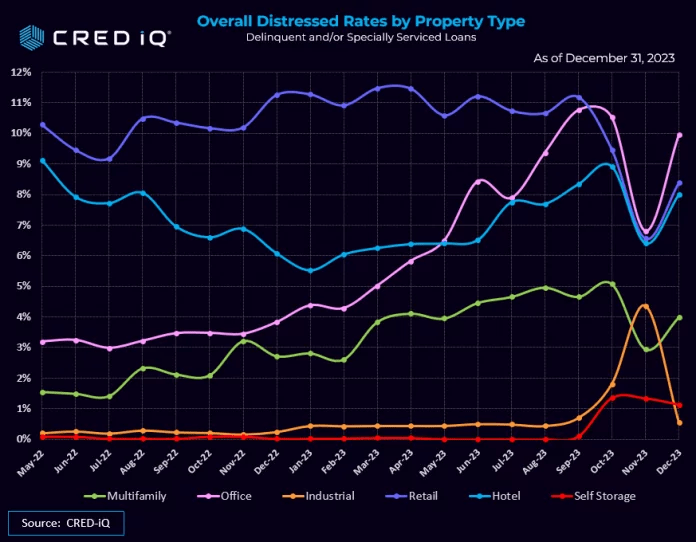
Industrial saw a large drop in December as a few very large loans were able to get worked out.