The U.S. Population Could Decline For The First In History This Year

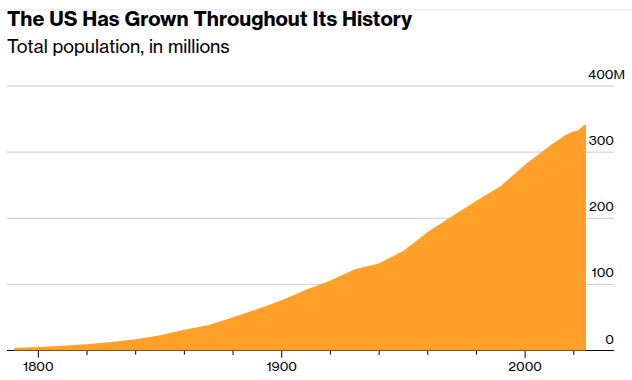
When the US Census last issued long-run forecasts for the population, the main prediction was that it would decline for the first time in 2081. Based on a sharp reduction in new births and net migration, it could now happen as early as 2026.

In the year prior to July 1, 2025 the population grew by only 0.5%, or 1.8 million people, its lowest growth since the pandemic. There were 519,000 more births than deaths, however, by 2030 that surplus is likely to disappear altogether, making the US entirely dependent on immigration for population growth.

Net migration is expected to fall to only 316,000 in the year prior to July 2026, with the US “trending toward negative net migration.” What complicates the picture is that the Census estimates start and end midyear, and with Trump’s policy moving quickly, the official data isn’t keeping up. The Census calculations released this week don’t include the second half of 2025, when the immigration crackdown accelerated.

Recent work by the center-right American Enterprise Institute and center-left Brookings Institution suggests the US is already experiencing net negative migration. Diving into the data available on inflows and outflows of both legal and undocumented foreign-born workers, they calculated the US had a net decline in the immigrant population of 10,000 to 295,000 in 2025. 

The biggest contributor to the slowdown in net migration has been a reduction in new arrivals rather than the high-profile deportations now receiving media attention.

If the low end of their 2026 prediction comes true and birth rates don’t spike in an unprecedented way, the US would have a decline of more than 400,000 in its overall population. Even at the midrange of their forecast, the country is at least flirting with a population decline. 

Since the US began taking censuses in 1790, such a decline has never been recorded. The only potential asterisk was 1918, when the domestic US population shrank slightly as a consequence of the Spanish flu and because some 2 million US soldiers were deployed abroad.
Source: Bloomberg
Renewal Rents Remain Strong While New Leases Fall

Shelter makes up about 33% of the Consumer Price Index (CPI), which is the most popular gauge of inflation.

The shelter component of CPI has remained stubbornly high for multiple reasons. It looks at the data on a significant lag, and a large component of the data collection is just calling people up and asking them what they think their home would rent for.

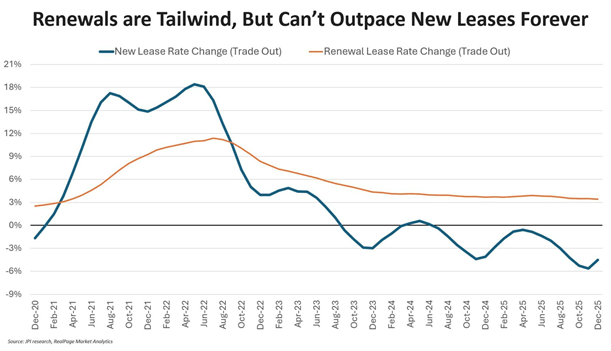
A less discussed reason is that while new rents have been falling in some markets, renewal rent growth has remained above 3%. Renewal rents make up about two thirds of all leases, depending on the market.

Source: Gavin Campbell

New Multifamily Supply Continues To Ease

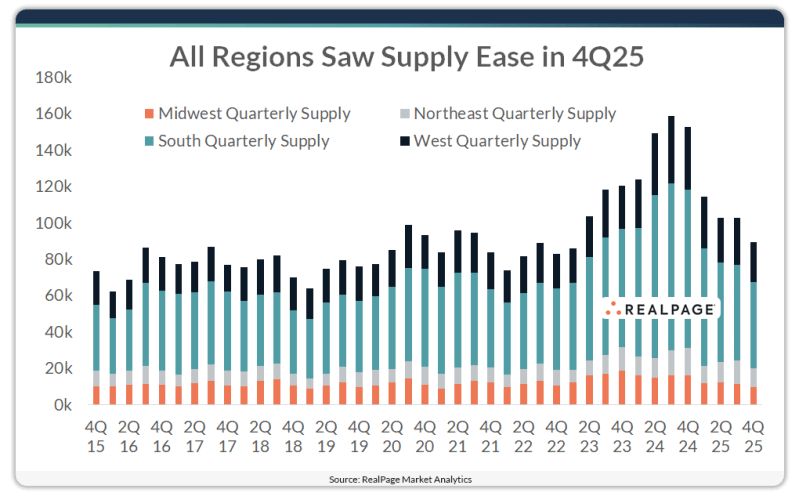
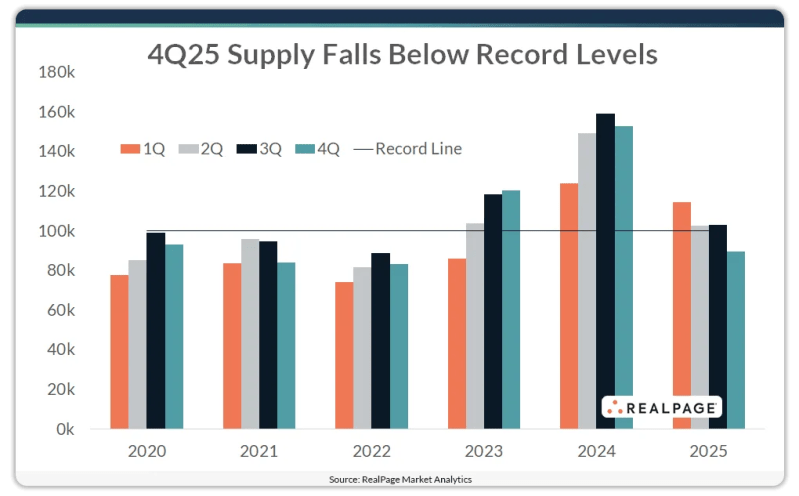
Roughly 89,400 units wrapped up construction in 4th quarter 2025, marking the first time in 11 quarters that deliveries fell below the 100,000-unit mark.

All regions of the U.S. saw supply volumes ease in 4th quarter, however, the South has also seen the steepest pullback in delivery volumes recently. Completions in the South peaked at nearly 91,800 units in 3rd quarter 2024 and volumes have fallen off every quarter since. The last three months of 2025 marked the first time South region completions totaled less than 50,000 units in 11 quarters.

Source: RealPage

Commercial Real Estate Cap Rates Trends By Property Sector

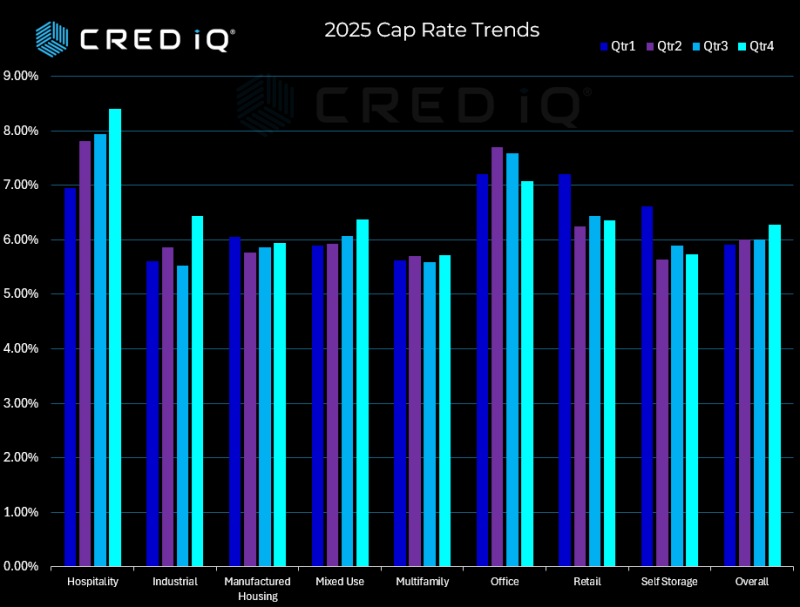
“Commercial real estate cap rates exhibited a steady upward trajectory throughout 2025, according to CRED iQ’s comprehensive loan analytics, with overall market cap rates expanding from 5.91% in Q1 to 6.28% by year-end. 

Multifamily properties demonstrated remarkable resilience, maintaining the tightest cap rate band among major property types. Starting at 5.63% in Q1 and finishing at 5.71% in Q4, multifamily’s mere 8-basis-point expansion reflects sustained investor confidence in residential fundamentals and the asset class’s defensive characteristics.”

The Seasonal Multifamily Leasing Pattern Has Shifted

The rental market tends to follow an established seasonal pattern. More people generally move during the spring and summer, and rent prices normally rise accordingly as multifamily operators increase rents in response to the spike in demand. During the fall and winter months we tend to see the opposite: less moving activity, and operators pulling back on rents to attract the dwindling set of renters still on the market for a new home.

This seasonality results from three practical factors: school, weather, and holidays. The summer is more favorable for all three: if you are a student or have young children, you don’t need to juggle school schedules; weather is generally more temperate; and moving expenses aren’t being eaten up by holiday spending. Renters who have the flexibility and means to relocate during the winter will generally find lower prices and more wiggle room for negotiating lease terms.

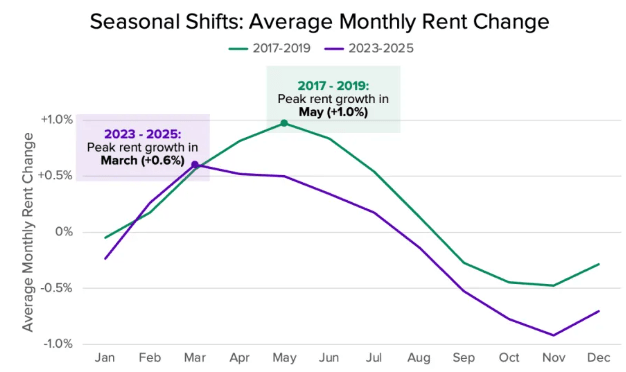
Over the past three years, we’ve seen a noticeable shift in the timing of this seasonality. Since 2022, rental activity is more evenly distributed throughout the calendar year, annual rent declines exceed annual rent increases, and peak rent growth has moved up earlier in the year. 

From 2017-2019, the typical seasonal pattern was this: nationwide rents would rise for seven months from February through August, with peak rent growth (+1.0 percent) occurring in May.

Since 2023, there has only been six months of rent growth each year, from February through July, with peak rent growth down to +0.6% and occurring two months earlier in March.

These shifts are due to a combination of factors including:

  1. The persistent impact of a one-time shock to the timing of moves due to the pandemic
  2. An intentional shift by multifamily operator to spread out lease renewal dates
  3. A supply rich environment offering renters more optionality and flexibility in their moves

Source: ApartmentList

Apartment Concessions Rise To 2008 Great Recession Levels

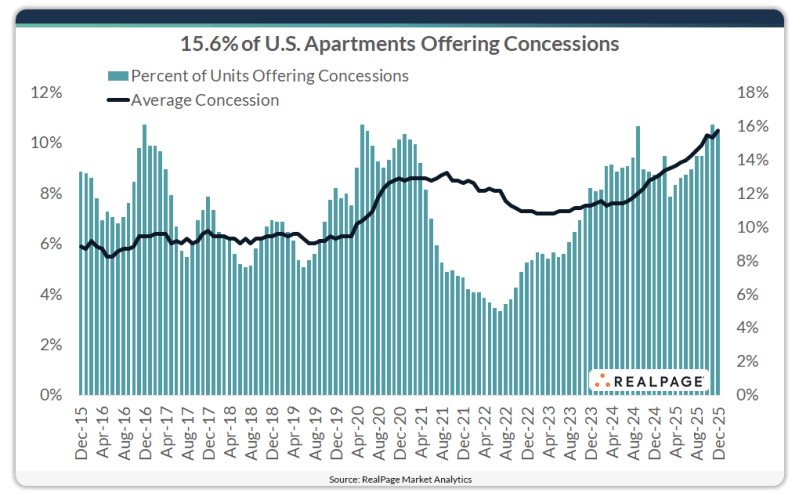
15.6% of stabilized apartments offered concessions in December, and the average December discount of 10.5% held essentially steady with October and November.

The October through December average sits at the highest discount depth since the post–Great Financial Crisis period (2010) and reflects ongoing efforts to absorb the elevated wave of new supply concentrated across the Sun Belt region. 

Class A units posted the deepest concession discount at 11.0%, followed closely by Class B (10.2%) and Class C (10.5%) units. However, Class C properties continued to show the highest usage, with 19.1% offering a discount in December. Concession usage in Class A and B stock was comparatively milder at roughly 13% to 14%. 

Source: RealPage

ApartmentList: The State Of Renting 2026 Report

Nearly half of renters (49%) say their income doesn’t allow them to save at all. 42% are choosing to stay in relationships—romantic or platonic—longer than they wanted because breaking up would mean breaking the bank.

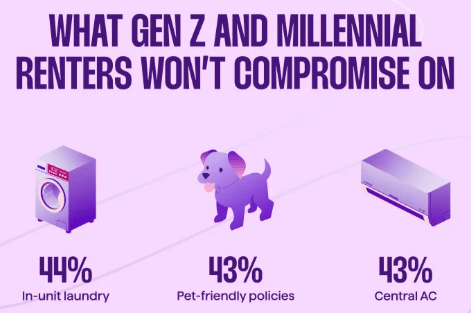
When looking for a home, the top three non-negotiables among Gen Z and millennials are in-unit laundry (44%), pet-friendly policies (43%), and central AC (43%). They’re clearer than ever about what makes their day-to-day lives better, and refuse to pay extra for the rest.

Sixty-three percent of renters we surveyed own a pet, and nearly half say they’ll always have one. For many, their pet is their roommate. No matter how nice an apartment looks on paper, a “no-pet” policy is often a dealbreaker.

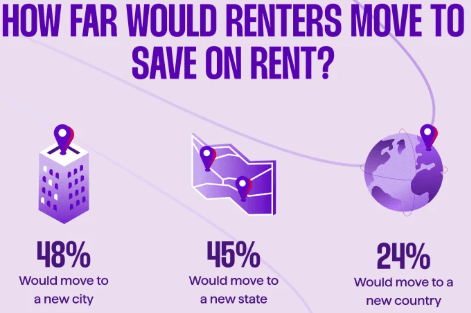
To save on rent, almost half of renters (48%) would consider moving to a different city, 45% to a different state, and 24% said they’d even move to a different country. Nearly a quarter of renters we surveyed said that finding a cheaper place to live is the single biggest factor driving their next move.

(56%) said they’d rent out their apartment on Airbnb for short-term stays to make extra income. For these renters, living in an Airbnb-friendly apartment can add more freedom and flexibility to their lifestyle, open up a new source of income, and make rent feel more manageable.

Source: ApartmentList

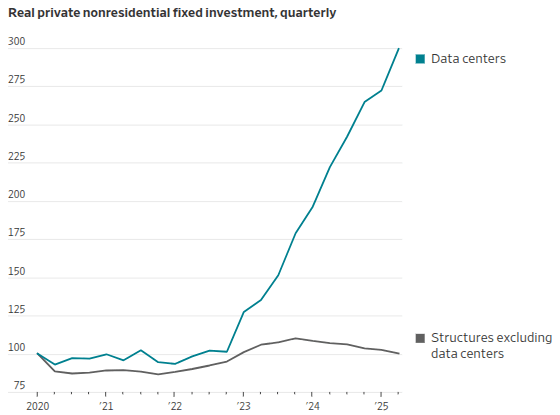
Builders Lose Appetite To Build Anything But Data Centers

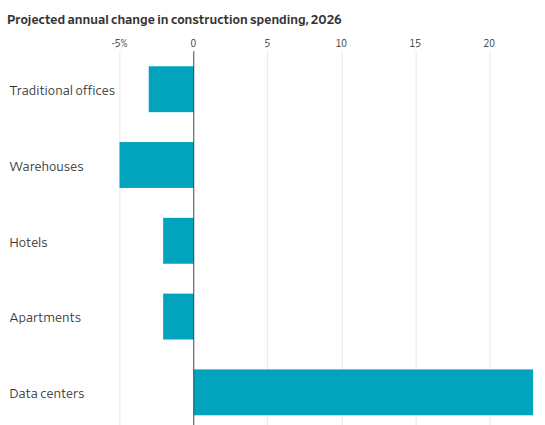
From the Wall Street Journal: “Commercial Builders Are Losing Their Appetite to Build Anything but Data Centers“

Higher interest rates, steeper material prices and a tight labor force provide significant headwinds to new construction this year. Spending to build offices, hotels, apartment buildings and warehouses is projected to fall in 2026.

Data centers, sought by large tech companies to run artificial-intelligence platforms, are a bright spot. Spending on construction of data centers will rise by 23% in 2026.

Highlights From Apollo’s 2026 Housing Outlook

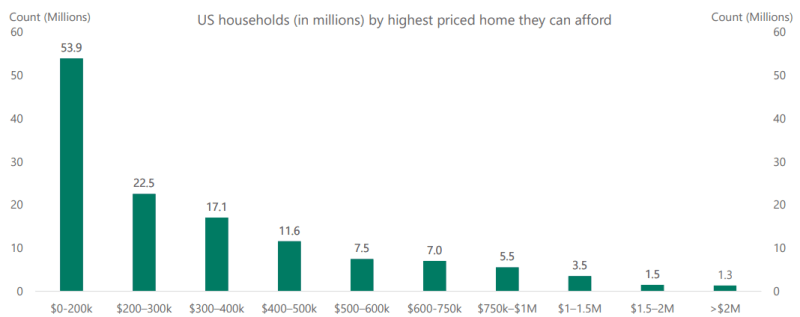
Most U.S. households cannot afford a home above $300,000:

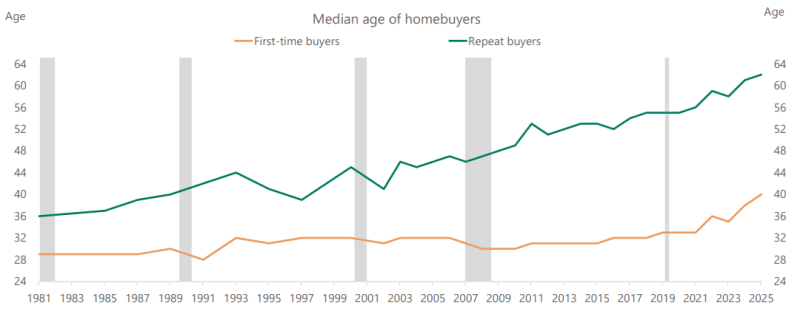
The median age of first-time home buyers has increased from 30 in 2008 to 40 today:

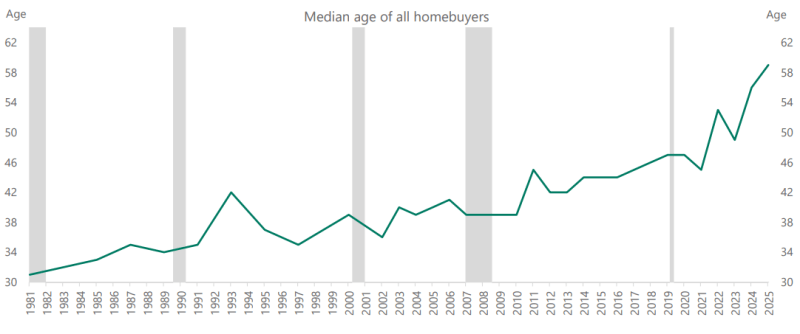
The median age of all home buyers is now 59 years old, up from 31 in 1981:

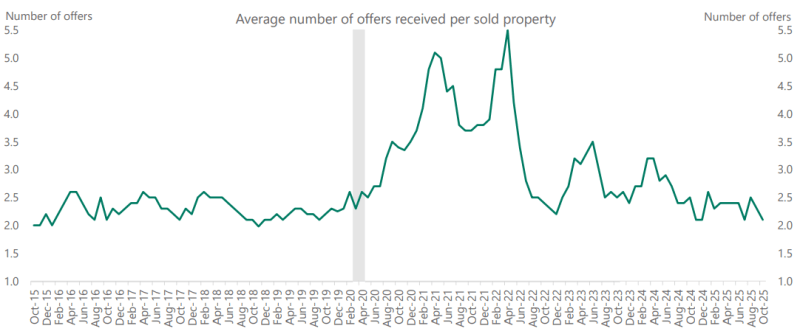
Number of offers received per property sold:

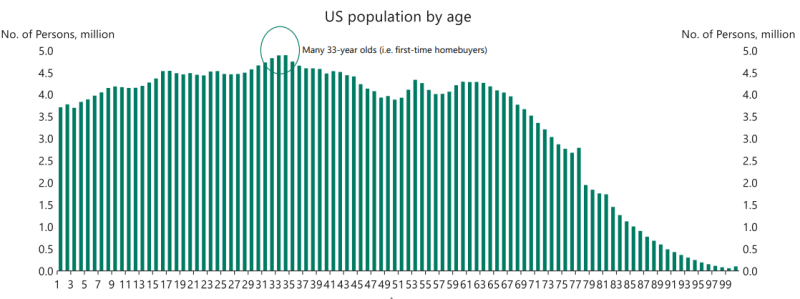
The largest age group is around 33 years old. These used to be home buyers, but many have shifted to renters looking for a nicer rental property.

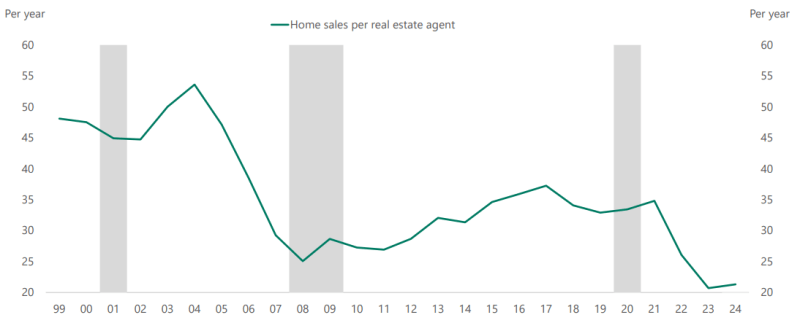
Homes sold per real estate agent:

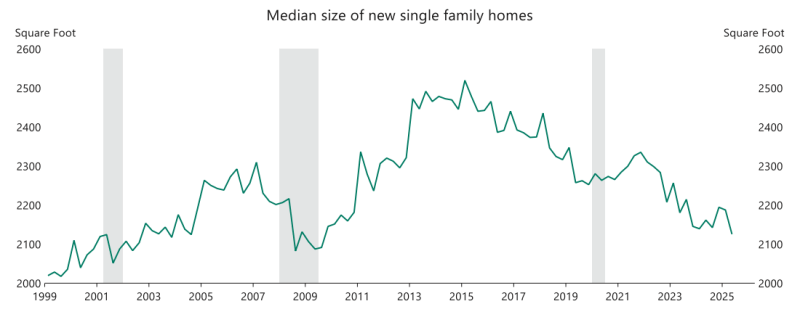
US homes are getting smaller. Median size of new single-family homes declining:

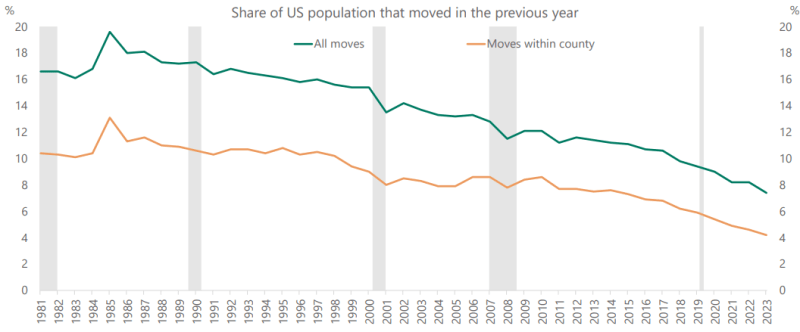
Structural decline in the share of the US population moving to a new address:

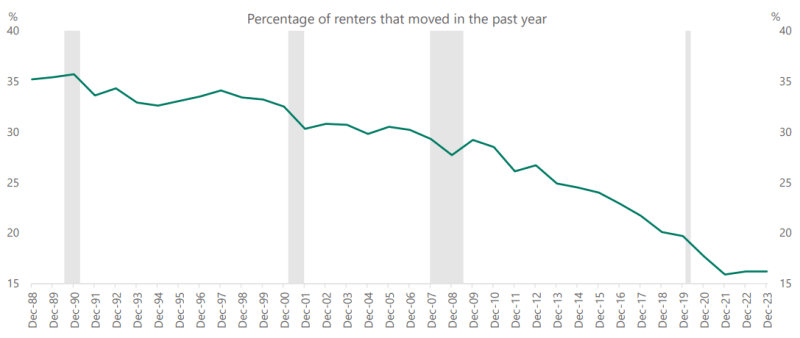
Trend decline in the percentage of renters moving to new apartments or houses:

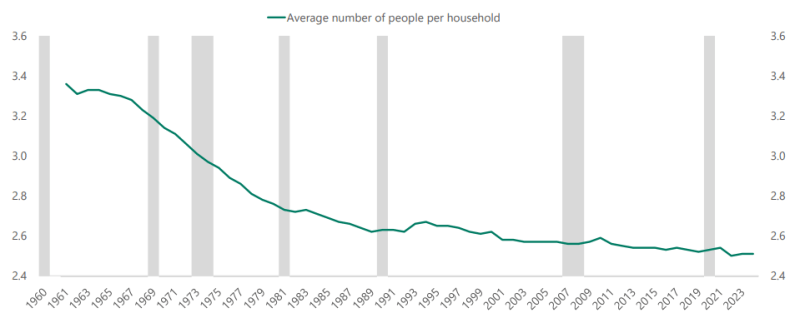
The average family size in the US has declined from 3.3 in 1960 to 2.5 by 2024:

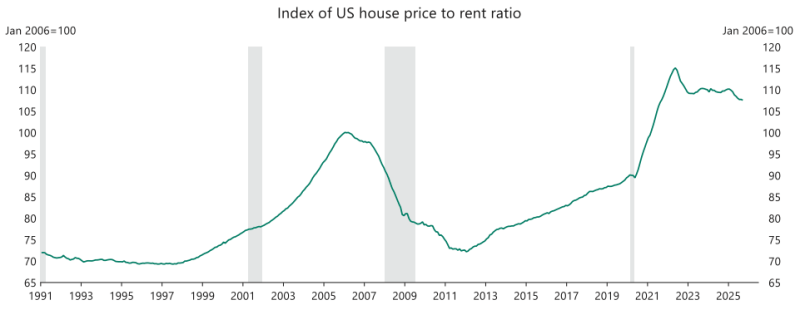
Home price to rent ratio remains elevated:

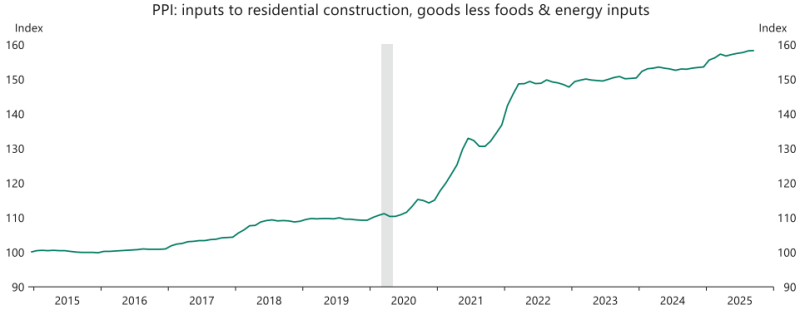
Housing construction costs remain high:

Source: Apollo