The U.S. Population Could Decline For The First In History This Year

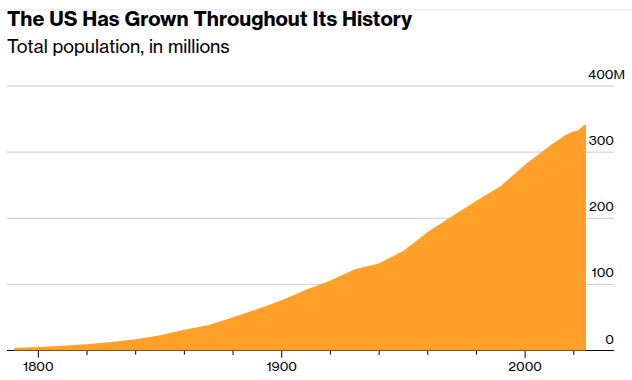
When the US Census last issued long-run forecasts for the population, the main prediction was that it would decline for the first time in 2081. Based on a sharp reduction in new births and net migration, it could now happen as early as 2026.

In the year prior to July 1, 2025 the population grew by only 0.5%, or 1.8 million people, its lowest growth since the pandemic. There were 519,000 more births than deaths, however, by 2030 that surplus is likely to disappear altogether, making the US entirely dependent on immigration for population growth.

Net migration is expected to fall to only 316,000 in the year prior to July 2026, with the US “trending toward negative net migration.” What complicates the picture is that the Census estimates start and end midyear, and with Trump’s policy moving quickly, the official data isn’t keeping up. The Census calculations released this week don’t include the second half of 2025, when the immigration crackdown accelerated.

Recent work by the center-right American Enterprise Institute and center-left Brookings Institution suggests the US is already experiencing net negative migration. Diving into the data available on inflows and outflows of both legal and undocumented foreign-born workers, they calculated the US had a net decline in the immigrant population of 10,000 to 295,000 in 2025. 

The biggest contributor to the slowdown in net migration has been a reduction in new arrivals rather than the high-profile deportations now receiving media attention.

If the low end of their 2026 prediction comes true and birth rates don’t spike in an unprecedented way, the US would have a decline of more than 400,000 in its overall population. Even at the midrange of their forecast, the country is at least flirting with a population decline. 

Since the US began taking censuses in 1790, such a decline has never been recorded. The only potential asterisk was 1918, when the domestic US population shrank slightly as a consequence of the Spanish flu and because some 2 million US soldiers were deployed abroad.

Source: Bloomberg

Manufacturing Is Thriving In The South

From the Washington Post: Manufacturing Is Thriving In The South:

The Rust Belt’s manufacturing decline isn’t primarily about jobs going to Mexico or China. It’s about jobs going to Alabama, South Carolina, Georgia and Tennessee.

In 1970, the Rust Belt was responsible for nearly half of all manufacturing exports while the South produced less than a quarter. Today, the roles are reversed, it is the Rust Belt that hosts less than one-fourth of all manufactured exports and the South that exports twice what the Rust Belt does.

This migration didn’t happen by accident. It was driven by specific policy choices. States such as Tennessee, Alabama, South Carolina and Texas have aggressively courted manufacturers by promising business-friendly policy environments. 

Economic research suggests that labor conflict drove much of the decline of the Rust Belt. Right-to-work laws in the South, by contrast, created more operational flexibility and attracted capital. The average unionization rate in the Rust Belt is 13.3 percent; in the South, it’s 4.3 percent. Southern states’ political leaders are quite open about how they see right-to-work as foundational to their competitiveness.

The South offers cheaper electricity, a critical input for energy-intensive manufacturing. Ten states in the South have industrial electricity rates under 8 cents per kilowatt-hour; zero states in the Rust Belt do. Ohio has some of the country’s most restrictive wind-energy setback regulations. You know who doesn’t? Texas.

Southern states have built so much housing that they kept costs from becoming unaffordable. Last year, both North Carolina and South Carolina each built more than four times as much new housing per capita as Massachusetts, according to U.S. census data. Florida, Georgia, Texas, Tennessee, South Carolina and North Carolina, all built more housing per capita than all of Illinois, Ohio, Michigan, Pennsylvania, California, New York and Massachusetts. That is not just a 2024 dynamic. That is true for every single year going all the way back to 1993. Comparatively low-cost housing makes it easier to attract and retain workers, which further attracts capital, which adds yet more investment and jobs, and the virtuous cycle spins upward.

Taxes and permitting contribute, too. With the exceptions of Arkansas and Kentucky, the other 10 states that host an SEC football school are all in the top 15 in terms of low state-level taxes. Permitting processes move faster, too. To give just one example, Georgia has a certified-site program that can fast-track construction projects. With regard to land, as one industry analyst put it: “For big projects that are going to employ three, four, five thousand people, you can find free land — zero cost land.” Immigration helps a lot, as well. More immigrants live in the South than any other region of the country. The region with the fewest immigrants? The Midwest. Immigrants promote growth, makes the workforce more robust, and create the goods and services that support manufacturing.

In 1992, there was not a single auto plant in Alabama. Today, Alabama is the No. 1 auto-exporting state, producing more than 1 million vehicles a year. That’s brought more than 50,000 jobs and billions of dollars in investment. Instead of a Big Three, it has a Big Five (Honda, Toyota, Hyundai, Mercedes-Benz and Mazda) along with an ever-expanding web of suppliers.

Even when companies do reshore operations, they are overwhelmingly choosing Southern states, not the Rust Belt. That hyper-automated Black & Decker factory went to North Carolina, not Pennsylvania. Manufacturing doesn’t chase nostalgia; it follows the bottom line.

North & South Carolina New Multifamily Supply

More than 59,400 units are under construction across North and South Carolina with an expected 45,700 of those units coming online in 2025. Virtually all of those units underway across the Carolinas are concentrated in six of the region’s 10 markets:

  1. Charlotte, NC: The largest market in the Carolinas had 25,064 units underway at the end of 2024. No stranger to new apartment supply, Charlotte has grown total inventory nearly 29% over the last five years, well above the national pace of roughly 11%. The 18,863 units expected to deliver to Charlotte in 2025 would set a 29-year high. With those new units, Charlotte’s existing unit base would expand another 7.8%
  2. Raleigh/Durham, NC: 13,799 units under construction in 4th quarter 2024, with 10,353 of those units expected to complete in 2025. Those new units would increase the unit base 5.0% this year. That growth rate comes on the heels of a prolonged supply wave as this market has grown total inventory 25% in the last five years.
  3. Asheville, NC: Punching above its weight in terms of new supply, developers are expected to add 3,509 units this year in Asheville, a small market in western North Carolina’s Blue Ridge Mountains. That would grow the existing unit count (26,745 units) a massive13.1%, notably above the U.S. norm. Over the past five years, the inventory base in Asheville has expanded 19.7%.
  4. Charleston, SC: Jumping to the Atlantic coast of South Carolina, supply is expected to climb with 3,867 units under construction. The majority of those units (3,213 units) are projected to complete in 2025, expanding total inventory 4.2% this year. This market has experienced a much smaller supply wave then neighboring markets as total inventory here has only grown 4.9% in the last five years.
  5. Greensboro, NC: Apartment inventory has expanded roughly 7% over the past five years. At the end of 2024, there were 3,458 units under construction with 2,664 of those units scheduled to complete in 2025. That would expand total inventory another 2.3% this year.
  6. Wilmington, NC: 3,212 units were underway at the end of 2024. This year, 2,438 of those units are expected to complete, growing total inventory 8.0%. In the last five years, this market has grown total inventory a staggering 36%

Four other markets round out the 10 largest apartment markets in North and South Carolina.

  • Myrtle Beach, SC: 2,168 units of new supply in 2025, growing inventory 4.0%. Existing unit count has expanded 31.2% over the last five years.
  • Greenville/Spartanburg, SC: During the past five years, inventory ballooned 20.8%. Another 1,200 units are expected to deliver in 2025, increasing inventory 1.5%.
  • Fayetteville, NC and Columbia, SC: Two smaller markets, both are expected to add roughly 700 units in 2025.

Source: RealPage

North & South Carolina Continue Strong Population Growth

The U.S. Census Bureau released the 2024 population growth statistics this week.

Total U.S. Growth:

Net international migration, which refers to any change of residence across U.S. borders (the 50 states and the District of Columbia), was the critical demographic component of change driving growth in the resident population. With a net increase of 2.8 million people, it accounted for 84% of the nation’s 3.3 million increase in population between 2023 and 2024. This reflects a continued trend of rising international migration, with a net increase of 1.7 million in 2022 and 2.3 million in 2023.

Natural increase also contributed to the population growth, as births outnumbered deaths by nearly 519,000 between 2023 and 2024. This marks an increase from the historic low in 2021 when natural increase was just over 146,000, but it was still well below the highs in prior decades.

The South:

At nearly 132.7 million residents, the South is the most populous region. With a population gain of nearly 1.8 million — a change of 1.4% between 2023 and 2024 — the South added more people than all other regions combined, making it both the fastest-growing and largest-gaining region in the country.

The largest contributing component to this growth was international migration, which added 1.1 million people. Domestic migration netted another 411,004 residents. The South was the only region with positive net domestic migration, where the number of people entering the region exceeded those leaving. Natural increase also contributed 218,567 to the growing region.

States:

Source: U.S. Census Bureau