As investment allocations to private markets have grown, so has the need for discernment. Private markets are not monolithic, and their underlying drivers move differently through the cycle. Some strategies remain tightly linked to monetary policy; others are grounded in property level cash flows and long-term structural forces. As conditions evolve, so too must capital positioning.
At this point in the cycle, real asset strategies—particularly private real estate—stand out. Their drivers are rooted in tangible demand and operational execution, and their valuation and income profiles look distinctly different from other parts of the private markets landscape.
From an allocation standpoint, real assets stand out for a different reason: they are typically less reactive to short-term market sentiment, correlated instead to long-term structural forces, such as supply imbalances and operating performance. For investors, they offer a compelling proposition as the cycle shifts: income and value creation anchored in the real economy, while participating in the long-term upside potential of real assets.
Why Private Real Estate Now?
- Income generation: Over the past two decades, more than 80% of long-term returns for a group of core private real estate funds tracked by NCREIF came from income. Notably, these distributions were tied to property level cash flows, including rents and lease structures, rather than policy rates. Those distributions can be highly tax efficient and, in many cases, competitive with or potentially superior to after tax yields from private corporate lending.
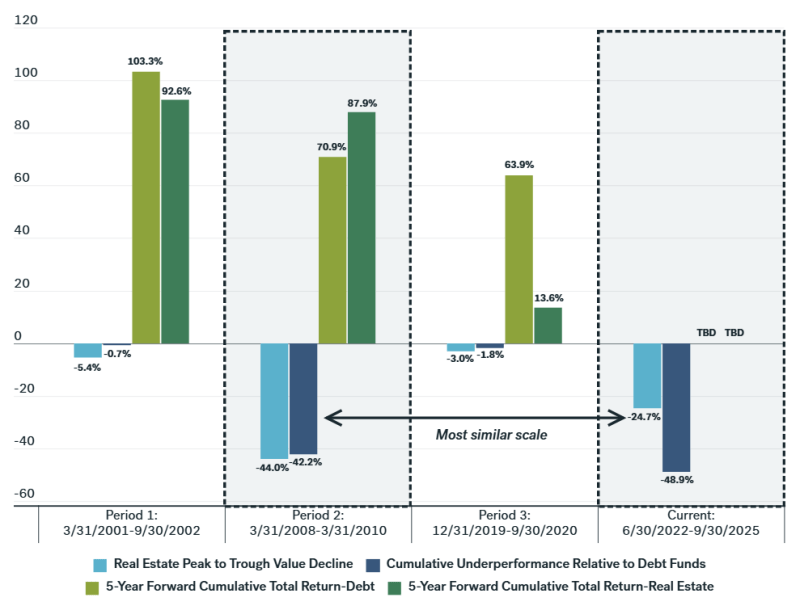
- Cyclical upside potential: Real estate values remain below prior peaks after a significant reset that began in mid 2022. Over this period, private real estate underperformed private corporate debt; if performance were to revert toward historical relationships, closing that gap implies potential upside approaching 60%.
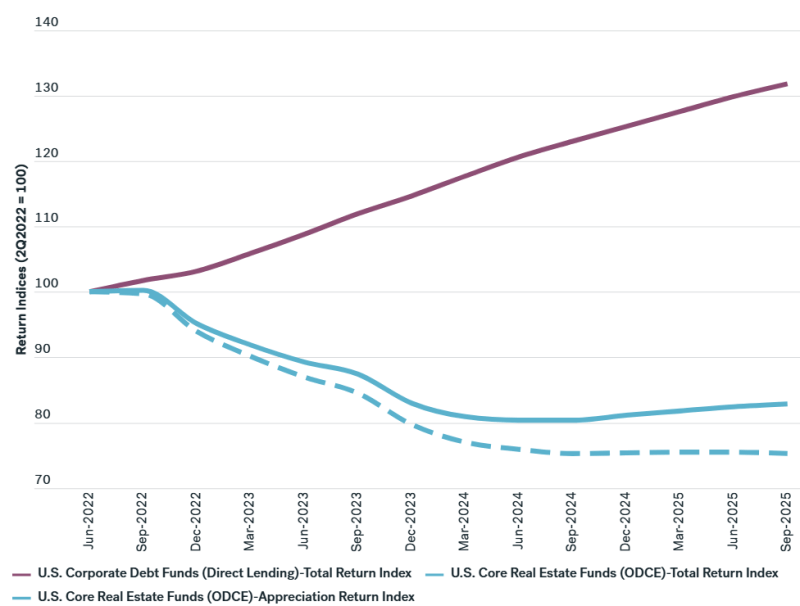
Looking across three comparable downturns, similar resets were followed by nearly 20% outperformance over the subsequent five years. Early signals have been giving a strong read that the turn is underway: core private real estate indices have now posted six consecutive quarters of positive returns after seven quarters of declines, suggesting the trough may be behind us.
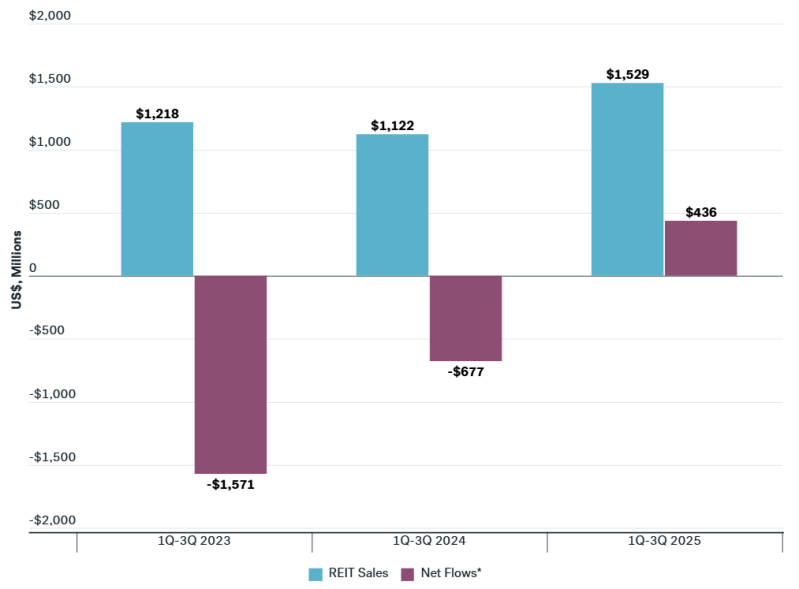
Capital flows show allocators are beginning to move. Among the largest non traded equity REITs, new investment activity has strengthened: capital raised over the first three quarters of 2025 is up 36% versus 2024, and net flows have shifted from negative to decisively positive. These are the kinds of signals we would expect as investors acknowledge the valuation reset and the compelling forward return profile of private real estate.
In today’s shifting environment, many investors risk finding themselves in overweight strategies whose strongest tailwinds are beginning to fade. After several years where elevated base rates created exceptionally strong income conditions, certain allocations now sit at cycle highs in portfolio weighting without the same income profile that supported them. Private corporate debt is one example of this dynamic at work: its role as a dependable income engine remains intact, but the forces that propelled its multi-year run have naturally been moderating.
At the same time, private real estate has been entering a very different part of the cycle, offering:
- potentially durable, property level income;
- historically attractive entry valuation;
- visible recovery potential; and
- direct alignment with long term real asset demand.
Source: Hines