Multifamily CMBS Distress Rises Again To Start 2024

After a brief decline in November, distress in multifamily CMBS loans U-turned higher again in to finish the year. The chart below shows the percentage of multifamily CMBS loans delinquent, with special servicers or unable to be paid off at maturity (green line).

It’s important to note that CMBS loans make up a small percentage of the multifamily pie, but they provide more transparent information compared to other loan types.

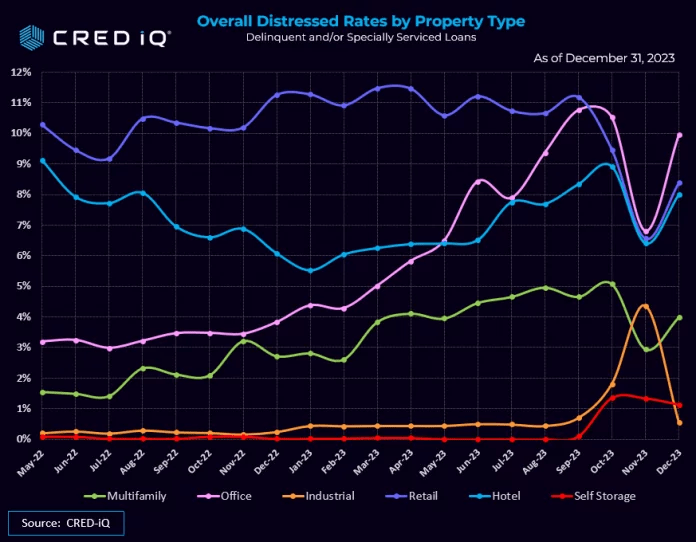
Industrial saw a large drop in December as a few very large loans were able to get worked out.

Source: CrediQ

Multifamily Rent Performance By City In North & South Carolina Entering 2024

Every city showed rent declines month-over-month and the last quarter of 2023. Only two (Rock Hill and Garner) managed to barely stay positive over the last six months.

City1 Month3 Month6 Month1 Year
High Point, NC-0.80%-3.38%-7.00%-11.01%
Matthews, NC-1.21%-4.45%-5.89%-6.64%
Wilmington, NC-0.92%-2.40%-3.95%-4.38%
Morrisville, NC-0.40%-4.79%-7.44%-4.35%
Raleigh, NC-1.15%-3.27%-4.13%-2.97%
Cary, NC-0.93%-2.42%-3.43%-2.68%
Durham, NC-1.23%-3.32%-3.80%-2.01%
Simpsonville, SC-0.90%-2.88%-5.09%-1.46%
Burlington, NC-1.16%-3.39%-3.15%-0.75%
Charleston, SC-1.00%-4.25%-4.83%-0.70%
Mount Pleasant, SC-0.87%-1.81%-1.13%0.35%
Winston-Salem, NC-1.57%-4.15%-3.32%0.80%
Mooresville, NC-0.36%-0.36%-2.09%0.86%
Apex, NC-0.72%-2.83%-2.95%2.30%
North Charleston, SC0.00%0.27%-0.99%2.43%
Greenville, SC-0.09%-0.88%-0.61%2.91%
Greensboro, NC-0.54%-2.72%-3.58%2.94%
Chapel Hill, NC-0.97%-0.97%-0.92%2.97%
Fayetteville, NC-2.40%-5.43%-4.37%3.09%
Charlotte, NC-1.00%-2.49%-2.13%3.18%
Rock Hill, SC-0.46%-0.18%0.89%3.25%
Garner, NC-0.08%-0.24%1.33%3.47%
Huntersville, NC-0.90%-0.90%-2.07%4.08%
Gastonia, NC-0.98%-0.88%-2.03%4.10%
Columbia, SC-0.39%-1.63%-1.47%5.35%

Source: Apartment List

Rental Competitiveness Rankings For Cities In The Carolinas & Georgia

RentCafe.com analyzed the 139 largest markets in the U.S. where data was available and ranked them based on five key metrics when it comes to rental competitiveness. These metrics were:

  • the number of days apartments stayed vacant
  • the percentage of rentals that were occupied
  • the number of prospective renters competing for an apartment
  • the percentage of renters who renewed their leases
  • the share of apartments completed this year

They then used these metrics to calculate a Rental Competitivity Index (RCI) to see how competitive the U.S. rental market was this year.

Here are how the major city/regions ranked in North Carolina, South Carolina and Georgia:

Market2023 ScoreVacant DaysOccupancy:Prospective RentersRenewal Rate% Of New Apts
Asheville, NC1103095.50%1265.50%1.30%
Fayetteville, NC893094.20%966.00%1.71%
Columbus, GA743294.00%862.70%2.30%
Savannah, GA693594.20%1158.50%2.57%
Greenville, NC633793.90%662.20%1.38%
Greenville, SC603593.30%959.90%3.28%
The Triangle, NC583493.60%860.70%3.80%
Columbia, SC563693.00%1155.20%0.72%
Charlotte, NC543693.20%960.50%4.19%
Macon, GA504192.90%962.10%1.68%
Suburban Atlanta, GA494492.70%864.40%2.88%
Athens, GA493892.50%863.60%5.16%
Charleston, SC423792.80%957.00%5.15%
Augusta, GA394091.30%763.40%5.51%
Wilmington, NC373792.30%760.60%3.54%
Atlanta, GA354191.90%959.30%2.07%
Piedmont-Triad, NC334292.00%860.30%2.86%

Source: RentCafe

Total Multifamily Debt Crosses $2 Trillion

Delinquencies remain low at Freddie Mac (0.29%), Fannie Mae (0.54%) and banks (0.40%). The trouble is brewing in the $67 billion of CMBS, CDO and ABS loans.

Multifamily debt by lender
Debt holderPercentageTotal held
Agencies and GSEs48%$986 billion
Banks and thrifts30%$606 billion
Life insurance companies11%$223 billion
State/local governments6%$115 billion
CMBS, CDO and ABS3%$67 billion

Source: Multifamily Dive

The Southeast Experienced 87% Of The U.S. Population Growth In 2023

The U.S. Census Bureau released their annual population trends data for 2023 yesterday. Americans continue to leave the northeast with the south experiencing the largest inflow of new residents; accounting for 87% of the nation’s growth in 2023.

Top 10 States by Numeric Growth: 2022 to 2023
1. Texas – 473,453
2. Florida – 365,205
3. North Carolina – 139,526
4. Georgia – 116,077
5. South Carolina – 90,600
6. Tennessee – 77,513
7. Arizona – 65,660
8. Virginia – 36,599
9. Colorado – 36,571
10. Utah – 36,498

Top 10 States by Percentage Growth: 2022 to 2023
1. South Carolina – 1.7%
2. Florida – 1.6%
3. Texas – 1.6%
4. Idaho – 1.3%
5. North Carolina – 1.3%
6. Delaware – 1.2%
7. District of Columbia – 1.2%
8. Tennessee – 1.1%
9. Utah – 1.1%
10. Georgia – 1.1%

Source: U.S. Census Bureau