Wages Are Rising While Multifamily Rents Are Flat Or Falling

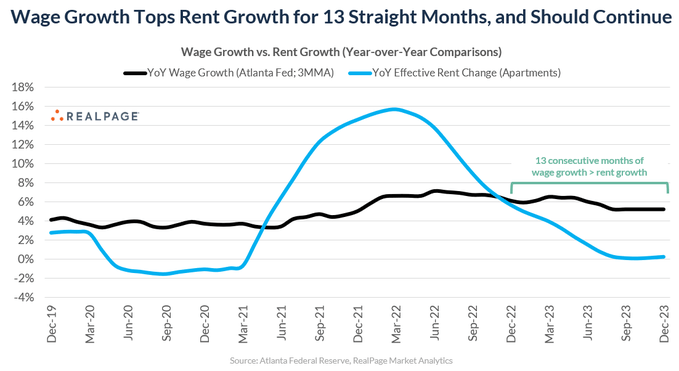
Wages have outpaced rent growth for 13 consecutive months. This trend is likely to persist in the near term helping to balance the massive rent outperformance in 2021.

In addition, wages rising by 4% have a much greater impact than rents rising by 4%. Why?

The median income in the United States is $59,540. A 4% increase is $2,316. If you subtract out a third for state and federal taxes, that leaves you with a $1,529 take home gain.

The median multifamily rent is $1,379 or $16,548 annually. A 4% increase is $662. If both wages and rents rise by 4% then the wage earner is gaining $867 annually ($1,529 – $662).

However, wages are currently rising by over 4% annually while rents are flat and falling:

The South Braces For A Tidal Wave Of New Multifamily Supply In 2024

There were 440,000 multifamily units delivered in 2023 with 670,000 expected in 2024. This is the year when the new supply relative to current inventory will rocket higher:

The south region is contributing over 50% of the new supply:

The major supply markets of 2023 will experience a tidal wave in 2024:

The following are the top 20 markets for new supply in 2023 relative to the size of their current inventory. All 20 of these markets were ranked in the top 22 for net absorption (demand). The supply/demand battle will be one to keep a close watch on as we move forward.

Source: RealPage

A Major Competitor for Multifamily Owners: Mom and Dad’s House

48% of Americans don’t own a home (36% rent and 11% live at home with their parents or other family members).

Due to the surge in rental costs over the past few years, about 25% of renters say they can no longer afford to make the payment, and they will have to move in with their family or friends.

For those who are able to remain in their current housing, 21% say they’re dependent on money from their family to do so – especially millennials and Gen Z (31% and 25%, respectively).

Source: Credit News

The South Is Booming But Mississippi Is Not Participating

From the summer of 2022 to the summer of 2023, the U.S. population grew by 1.6 million people, with 1.4 million of them—almost 87%—in the South, according to U.S. Census Bureau estimates. But Mississippi essentially missed out on that growth. It gained just over 750 residents during the same period.

This October, according to U.S. Bureau of Labor Statistics data, Mississippi’s civilian labor force had shrunk 1.4% from what it was a decade earlier, even as the South’s workforce overall has grown exponentially.

Only about half of the graduates from Mississippi’s public universities work in the state three years after graduation. Many leave for growing metropolitan areas in other parts of the South. The state has had one of the highest poverty rates in the nation for years. About 12.6% of the state’s population under the age of 65 have a disability, compared with 8.9% overall in the U.S.

Troubles in the capital city of Jackson, the largest city, have pushed many to leave the state. Jackson has seen its population decline from 173,500 in 2010 to 146,000 in 2022, according to Census estimates.

Source: Wall Street Journal

U-Haul’s Top Growth States Of 2023

U-Haul calculates each state’s net gain (or loss) of one-way equipment from customer transactions in a calendar year. It shows the states people are moving to (highest on the list) and where they are leaving from (lowest on the list). The number in parenthesis is where the state ranked in 2022.

2023 U-Haul Growth States

1.TEXAS (1)
2.FLORIDA (2)
3.NORTH CAROLINA (4)
4.SOUTH CAROLINA (3)
5.TENNESSEE (6)
6.IDAHO (10)
7.WASHINGTON (23)
8.ARIZONA (7)
9.COLORADO (11)
10.VIRGINIA (5)
11.NEVADA (13)
12.VERMONT (30)
13.UTAH (12)
14.WYOMING (33)
15.DELAWARE (27)
16.NEW MEXICO (19)
17.ARKANSAS (43)
18.GEORGIA (8)
19.SOUTH DAKOTA (31)
20.MINNESOTA (17)
21.MONTANA (18)
22.ALABAMA (20)
23.OHIO (9)
24.IOWA (21)
25.HAWAII (–)
26.WISCONSIN (16)
27.INDIANA (14)
28.MISSOURI (15)
29.KENTUCKY (26)
30.WEST VIRGINIA (25)
31.MAINE (29)
32.NORTH DAKOTA (37)
33.KANSAS (39)
34.ALASKA (41)
35.NEBRASKA (32)
36.RHODE ISLAND (40)
37.OREGON (22)
38.PENNSYLVANIA (24)
39.MISSISSIPPI (34)
40.NEW HAMPSHIRE (38)
41.OKLAHOMA (42)
42.CONNECTICUT (28)
43.NEW YORK (46)
44.MARYLAND (44)
45.LOUISIANA (35)
46.MICHIGAN (48)
47.NEW JERSEY (45)
48.ILLINOIS (49)
49.MASSACHUSETTS (47)
50.CALIFORNIA (50)

Atlas Van Lines’ Top 10 States For Inbound Migration In 2023

The South accounted for 87% of the country’s population growth in 2023, with a net migration of 1.4 million new residents, of which over 700,000 were domestic. The Midwest and West have both seen modest gains, while the Northeast’s population has fallen 0.1%.

Top 10 states for inbound/outbound moves in the continental U.S.
InboundOutbound
1. Maine1. Illinois
2. North Carolina2. Pennsylvania
3. New Hampshire3. Louisiana
4. Montana4. Minnesota
5. Washington5. Indiana
6. Arkansas6. Oregon
7. Florida7. Iowa
8. New Mexico8. Mississippi
9. District of Columbia9. New York
10. Texas10. Ohio

Source: Multifamily Dive

North and South Carolina Single-Family Home Price Growth and Affordability Entering 2024

The following chart shows the percentage gains (or declines) for home values over a 1, 3 and 12 month period in the Carolinas.

The last column shows the percentage of the median income it takes to make a home payment (principle, interest, taxes and insurance) in that city. It assumes a 5% down payment and 30-year mortgage rates at 6.5%, which is where they were as of this morning.

Historically, borrowers were considered safe if less than 28% of their monthly payment was going to toward the mortgage payment. As of this month, every single city is above 28% with most significantly above, and that is coming off a massive decline in mortgage rates over the last 60 days (they were above 8% at the end of October).

CityStateMonthly3 MonthAnnual%
AndersonSC0.07%-0.06%9.50%42%
GrahamNC0.47%1.97%8.70%48%
FayettevilleNC0.40%1.47%8.10%38%
JacksonvilleNC0.58%1.66%7.90%42%
New BernNC0.38%1.12%7.80%42%
TarboroNC1.03%2.36%7.70%29%
CharlestonSC0.84%3.50%7.30%60%
GoldsboroNC0.28%0.82%7.20%40%
OxfordNC0.43%1.34%7.00%41%
AberdeenNC0.46%1.05%6.90%38%
SanfordNC0.26%1.22%6.60%45%
ShelbyNC-0.83%-1.62%6.60%38%
AsheboroNC0.51%2.38%6.40%45%
ButnerNC0.22%0.68%6.30%32%
GreenvilleNC0.28%1.31%6.20%38%
HendersonNC0.79%1.34%6.20%34%
LexingtonNC0.55%2.43%6.20%51%
North CharlestonSC0.59%2.16%6.20%42%
WilmingtonNC0.35%1.20%6.10%57%
BurlingtonNC0.43%1.65%6.00%35%
BooneNC0.33%1.26%5.80%79%
Siler CityNC0.13%0.63%5.80%45%
ElkinNC0.39%1.76%5.70%36%
Rocky MountNC0.58%1.93%5.70%36%
WilsonNC0.24%0.81%5.70%47%
Chapel HillNC0.41%2.03%5.60%61%
Elizabeth CityNC0.72%2.35%5.60%39%
LenoirNC0.55%2.24%5.40%40%
KingNC0.52%1.81%5.30%35%
Southern PinesNC0.16%0.51%5.00%55%
High PointNC0.25%1.40%4.80%38%
MorgantonNC0.44%1.82%4.70%44%
Winston-SalemNC0.60%2.43%4.70%40%
LaurinburgNC0.31%1.24%4.60%33%
NewportNC0.36%0.85%4.60%44%
WaynesvilleNC0.50%40.51%4.60%56%
HillsboroughNC0.49%1.88%4.50%47%
GreensboroNC0.31%1.34%4.40%37%
PinehurstNC0.16%0.62%4.40%58%
HickoryNC0.42%1.35%4.20%46%
WilkesboroNC-0.26%0.11%4.20%49%
North Myrtle BeachSC0.62%1.34%4.20%51%
ColumbiaSC0.34%1.10%4.10%37%
LincolntonNC0.35%1.77%4.00%41%
SpartanburgSC0.50%2.06%4.00%38%
AshevilleNC0.59%1.95%3.90%66%
Goose CreekSC0.46%1.52%3.90%40%
SumterSC0.02%0.32%3.80%31%
KinstonNC0.36%0.52%3.70%32%
LumbertonNC0.10%0.37%3.70%34%
PittsboroNC0.16%0.66%3.60%57%
HendersonvilleNC0.23%1.05%3.40%56%
GreenvilleSC0.44%1.14%3.40%40%
ClemmonsNC0.29%1.12%3.20%41%
JamestownNC0.10%0.67%3.20%49%
ArdenNC0.50%1.68%3.00%52%
EasleySC0.20%0.48%3.00%41%
CreedmoorNC0.18%0.80%2.70%41%
SalisburyNC0.37%1.24%2.40%42%
StatesvilleNC0.26%1.21%2.20%45%
CarthageNC-0.07%0.37%2.10%39%
KernersvilleNC0.27%1.04%2.10%40%
LelandNC0.15%0.46%2.10%50%
FlorenceSC0.54%0.86%1.90%32%
GreerSC0.21%0.76%1.80%38%
SummervilleSC0.28%1.01%1.80%44%
Boiling SpringsSC0.25%1.26%1.70%41%
DuncanSC0.29%1.26%1.60%37%
OrangeburgSC0.43%0.46%1.50%42%
ApexNC0.25%1.10%1.40%39%
MebaneNC0.19%1.30%1.40%43%
SimpsonvilleSC0.11%0.50%1.40%37%
DurhamNC0.33%1.21%0.90%49%
RaleighNC0.06%0.46%0.90%46%
CharlotteNC0.41%1.59%0.80%46%
ShallotteNC-0.05%-0.21%0.80%50%
Myrtle BeachSC-0.02%0.24%0.30%46%
ConwaySC0.19%0.37%-0.30%50%
LancasterSC0.26%0.82%-0.50%50%
MorrisvilleNC0.24%0.67%-1.20%37%
ClaytonNC0.06%0.16%-3.20%39%
GaffneySC-1.10%-4.20%-4.80%45%
NewberrySC0.16%-1.05%-9.00%35%

Source: Zillow