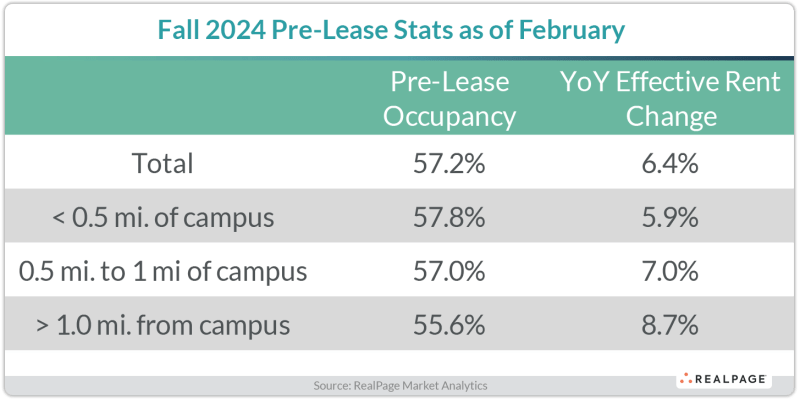
The February pre-lease rate is just below last year’s all-time high of 58.2% through February 2023. The long-term average is around 50% through February.
Source: Real Page
The February pre-lease rate is just below last year’s all-time high of 58.2% through February 2023. The long-term average is around 50% through February.
Source: Real Page
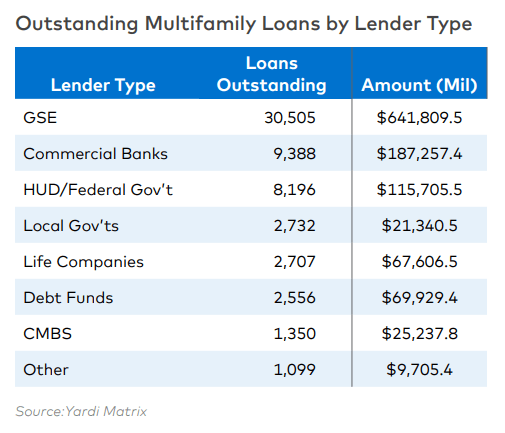
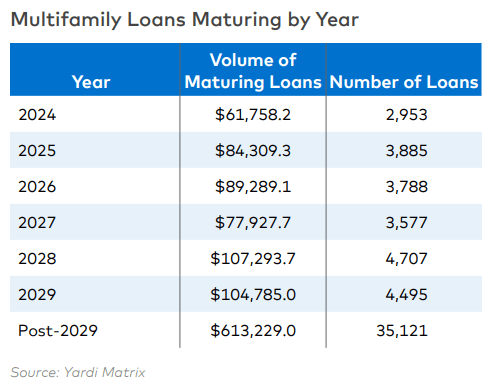
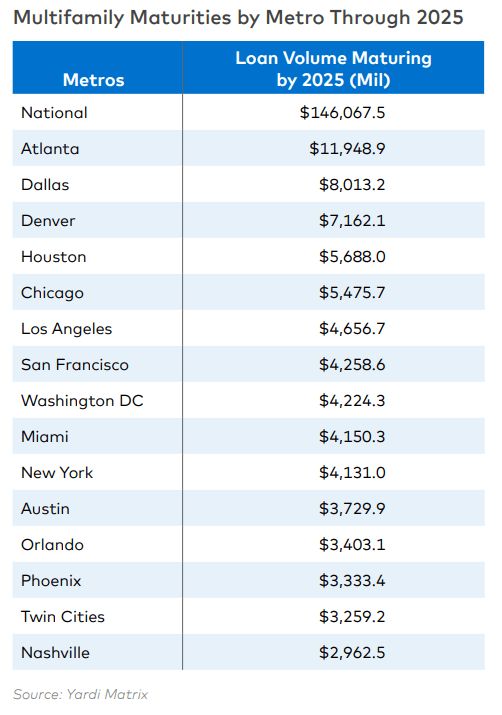
The multifamily debt market totals $1.1 trillion, with about half of those loans set to mature over the next 5 years (58,533 properties).
$150 billion in debt (6,800 multifamily properties) will mature by the end of 2025.

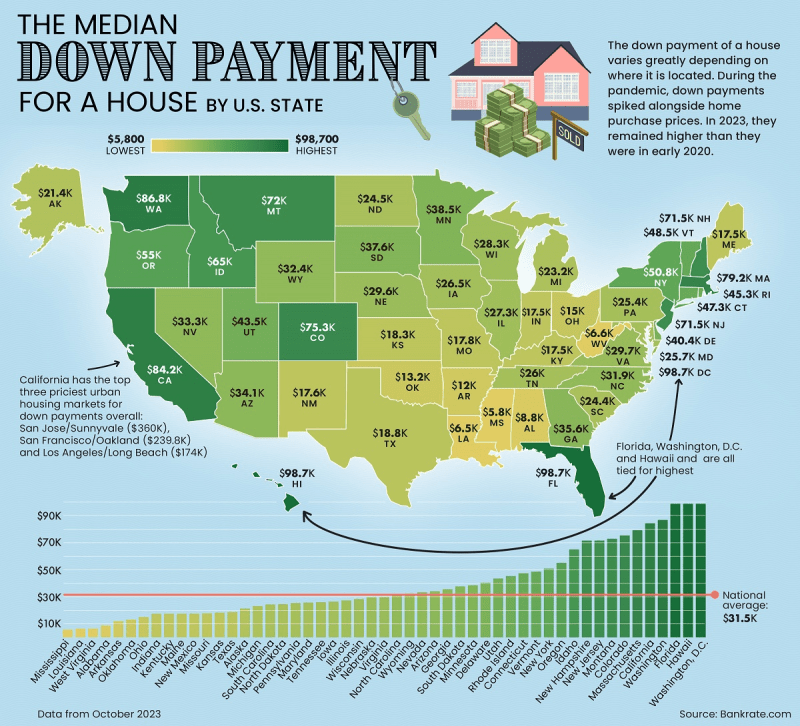
The national average is $31,500, which is a 15% down payment for the home.
The rankings are based on job growth, wage growth, high-tech GDP, broadband access, housing affordability, community resiliency (to natural disasters) and income inequality.
The following are the North and South Carolina cities that made the lists and their rankings:
LARGE CITY RANKINGS:
Tier 1 Large Cities:
2. Raleigh, NC
10. Charlotte, NC (includes Concord and Gastonia)
11. Charleston, NC (includes North Charleston)
Tier 2 Large Cities:
19. Myrtle Beach, SC (includes Conway and North Myrtle Beach)
21. Wilmington, NC
36. Durham, NC (includes Chapel Hill)
38. Greenville, SC (includes Anderson and Mauldin)
Tier 3 Large Cities:
61. Asheville, NC
86. Winston-Salem, NC
109. Columbia, SC
115. Hickory, NC (includes Lenoir and Morganton)
124. Spartanburg, SC
Tier 4 Large Cities:
164. Greensboro, NC (includes High Point)
180. Fayetteville, NC
SMALL CITY RANKINGS:
Tier 1 Small Cities:
(None)
Tier 2 Small Cities:
9. Jacksonville, NC
43. Hilton Head, SC (includes Bluffton and Beaufort)
Tier 3 Small Cities:
63. Greenville, NC
90. Florence, SC
Tier 4 Small Cities:
139. Sumter, SC
158. New Bern, NC
Tier 5 Small Cities:
185. Rocky Mount, NC
193. Goldsboro, NC
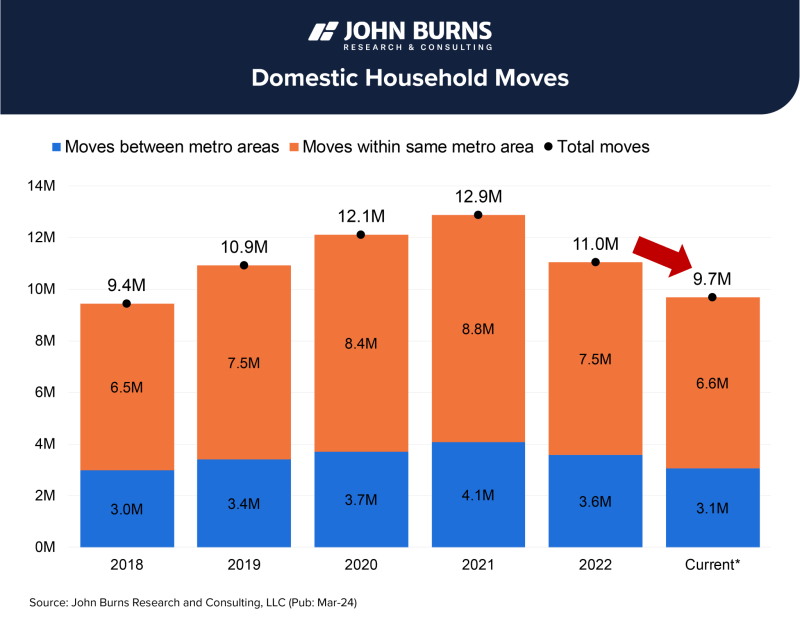
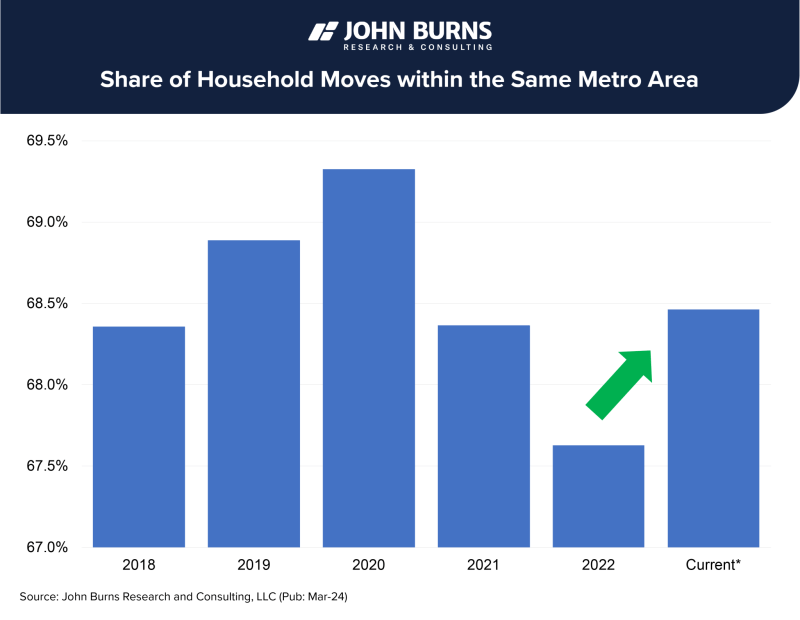
If people do move, a larger percentage are staying in the same Metro area:
2. High-growth markets have become increasingly expensive to buy and rent homes, forcing many potential home buyers to relocate to a nearby, smaller market with more affordable homes.
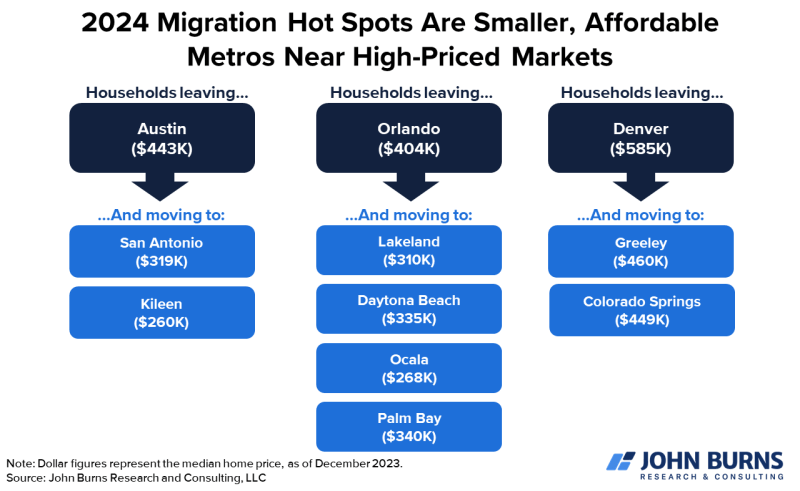
3. Some regions are experiencing strong positive migration and housing demand while others are experiencing the opposite:

Source: John Burns Consulting
From the Wall Street Journal this week:
“While office towers have typically shaped the American city skyline, builders are now pushing apartments higher into the clouds. High-rises were just 2% of new apartment supply during the 1990s, but rose to 14% in 2022.
The bigger approach to multifamily development reflects the evolving economics of the business and the dynamics of the current housing market.

Rising construction and other costs mean that developers often need to build more units to be profitable. For years, they have been designing smaller apartment units, allowing them to fit more into each building. The average square footage of a new apartment unit fell 6% from 2013 to 2022.

Lack of available land is also causing taller buildings to sprout. Some cities are tweaking zoning and other building codes to make larger-scale construction more feasible.”
Source: Jay Parsons & The Wall Street Journal
Publicly traded REITs can be priced above or below their Net Asset Value (NAV), which is an estimate of what the real estate they own is worth right now.
A discount exists because REITs (which are essentially traded like stocks) look forward to where they think prices are going in the future. If the market is bearish on the sector and believes the underlying values will fall from where they are today, then REITs will “price in” the decline and trade at a discount to their NAV.
The opposite is true when the market is bullish on the sector; REITs will “price in” a positive NAV.
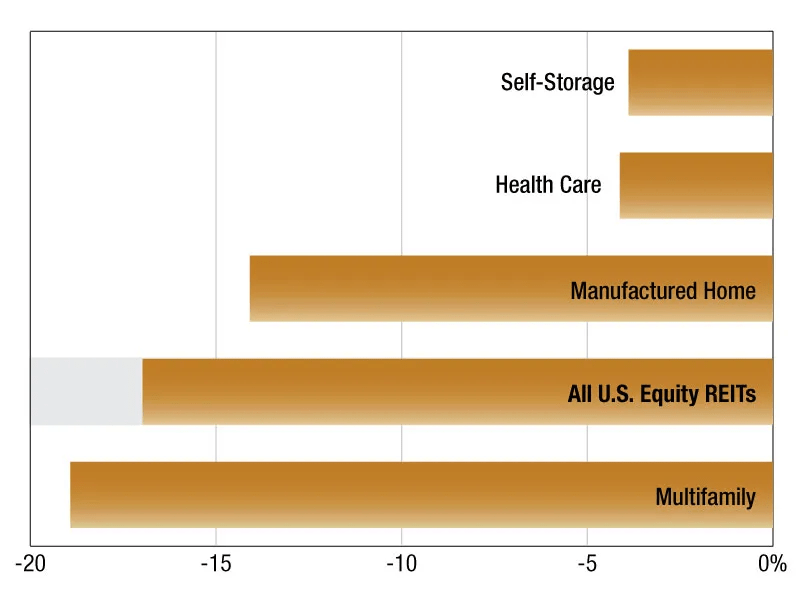
Here is a snapshot of where the multifamily sector is today compared to other REIT categories:
This is not unusual. This following graph shows the historical U.S. REIT premium/discount to NAV going back to 2000:
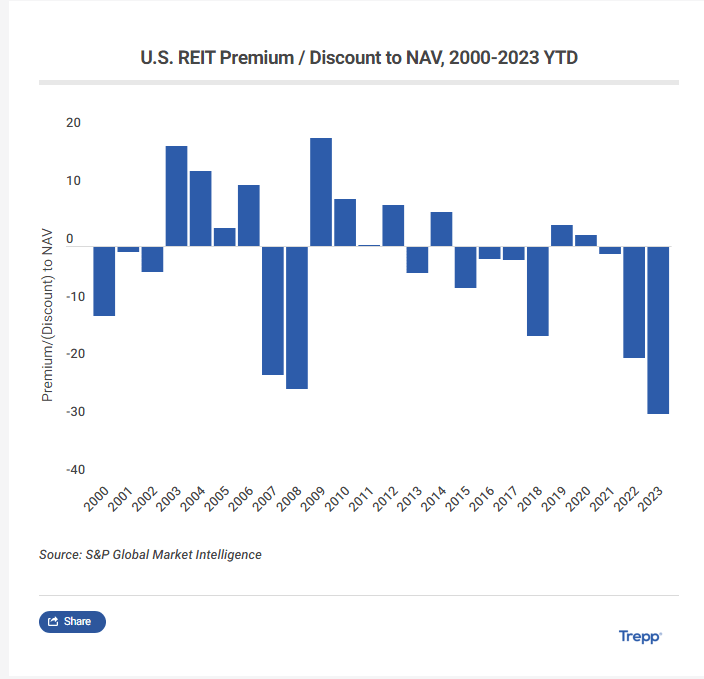
Source: Multihousing News & Trepp
It’s important to note that CMBS loans make up only about 3% of the total $2 trillion in multifamily debt, but we’re offered significantly more transparency to what is happening within this piece of the pie:
Source: Trepp
| Source: | Month: | Monthly Change: | Annual Change: | Vacancy: |
| Apartment List | January | -0.30% | -1.00% | 6.50% |
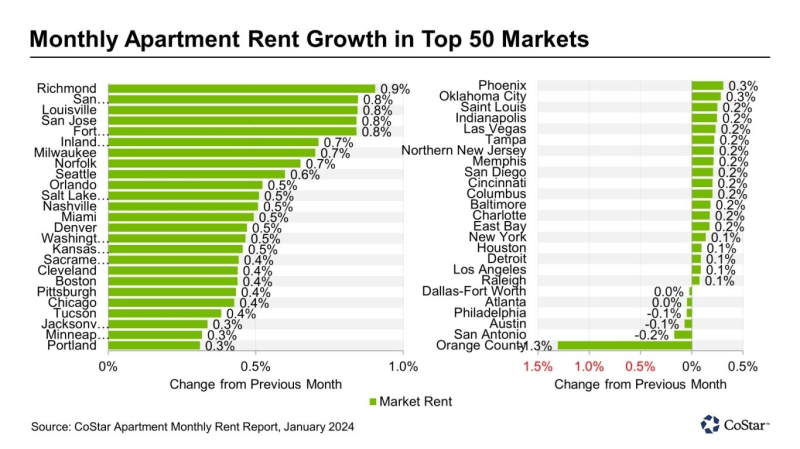
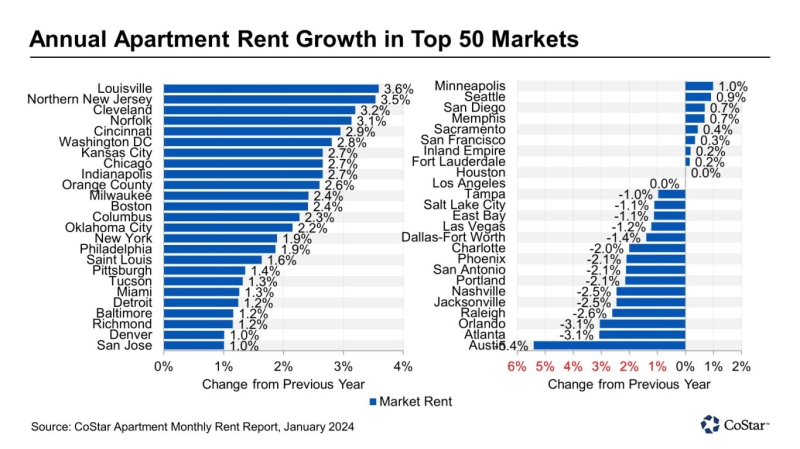
| CoStar | January | 0.22% | 0.66% | 7.60% |
| Apartments Advisor | January | 0.50% | -2.03% | N/A |
| Apartments.com | January | 0.70% | 0.20% | N/A |
| RealPage | January | N/A | 0.30% | 5.90% |
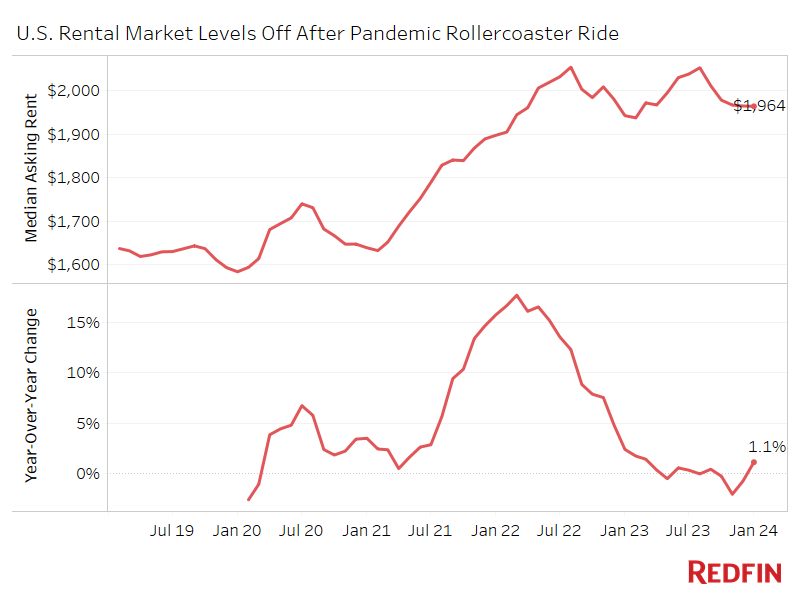
| Redfin | January | 0.00% | 1.10% | N/A |
| Zillow | January | N/A | 4.70% | N/A |
| Yardi Matrix | January | 0.00% | 0.50% | N/A |
| Rent.com | January | -0.04% | 1.10% | N/A |
| Realtor.com | January | -0.06% | -0.30% | N/A |
| Average: | 0.13% | 0.52% | 6.67% |