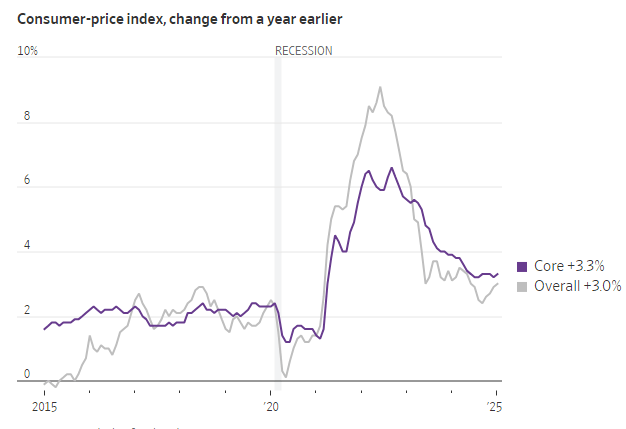
What It Is: Tracks a basket of commons items people by like food, gas, rent, healthcare and clothing. Compares the prices to the previous month and provides percentage change.
Jumped 0.5% on the month and brought the annual rate up to 3.0%, which were higher than expected
This is the seventh straight month of accelerating month-over-month CPI prints
Core CPI, which removes more volatile food and energy prices, rose 0.4% monthly and 3.3% annually, which were higher than expected
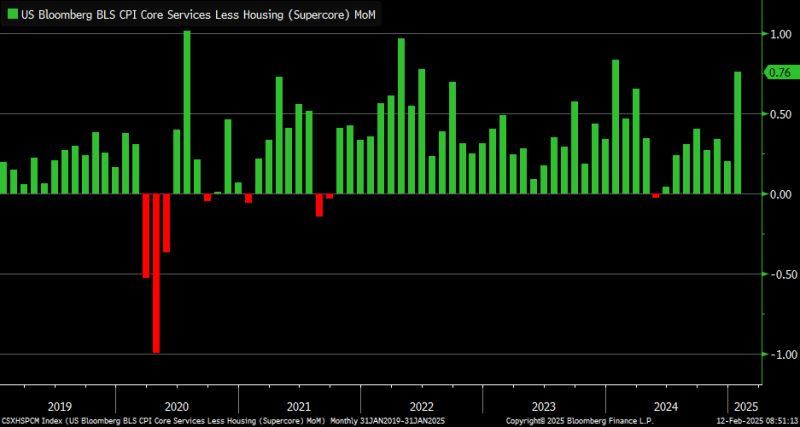
The Supercore CPI (excludes food, energy and shelter) exploded higher to 0.7% month-over-month bringing the annual rise to 4.0%
What It Means: A hotter than expected CPI report makes the Fed less likely to cut interest rates in the coming months
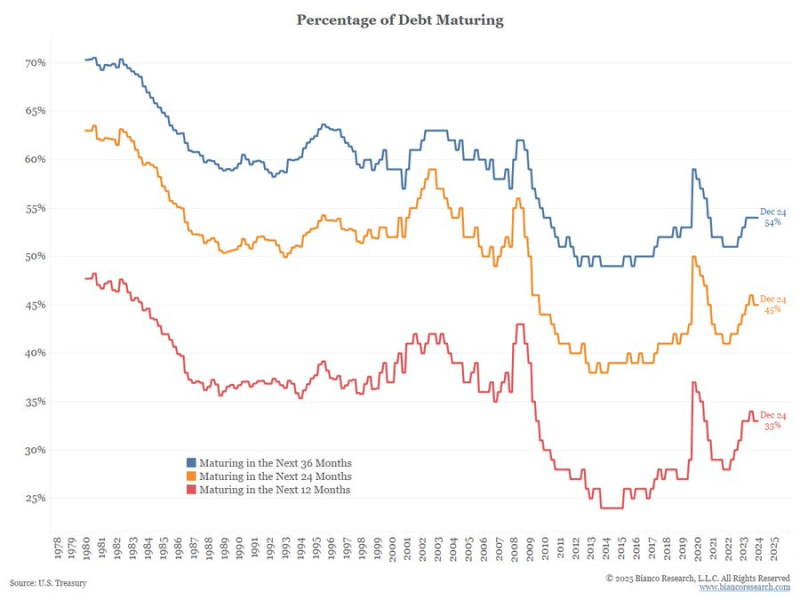
There’s been a fear cycle in the media recently talking about how 1/3 of the federal debt needs to be refinanced in the next year (and how this will negatively impact treasury yields). In reality, 1/3 of the debt always needs to be refinanced in the next year and about half always needs to be refinanced in the next 3 years. See below going back to the late 70’s:
This trend has been consistent since about mid-2023. While stronger rent growth among smaller markets can be inspired by lower inventory growth rates, the more likely scenario is that these markets are less likely to see drastic fluctuations in performance. Smaller markets display more resilience during hard times, missing the declines seen in bigger markets. At the same time, smaller locales don’t benefit from the same upside as larger markets during good times, either.
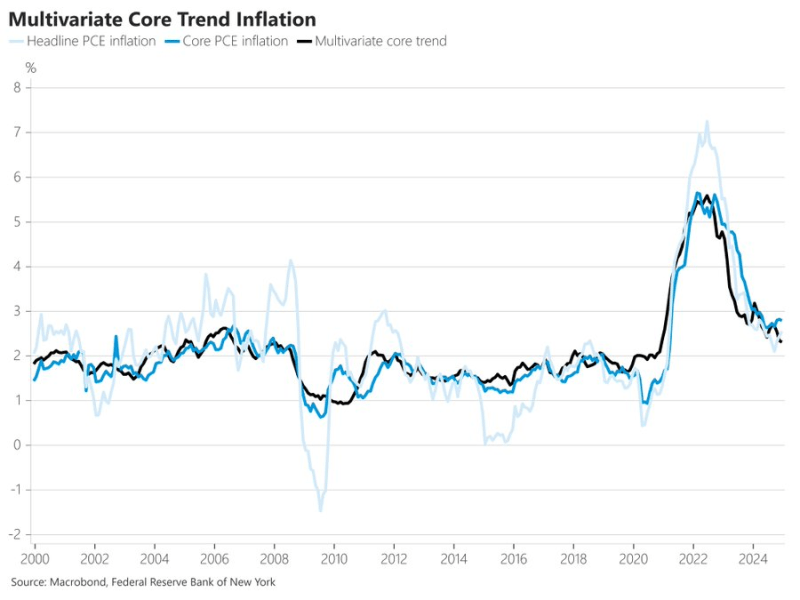
Last week brought the most recent Core PCE print. While the headline came out at 2.8%, most economists would say it’s really more like 2.3%. The monthly Core PCE was just 0.2%, annualizing at 2.4%. That’s a better real time measure of inflation than comparing to where we were a year ago, which was 0.5% monthly rate (annualizing at 6%).
The 3-month Core PCE average is 2.3%, the 6-month average is 2.3%, and the 9-month average is 2.3%. If we strip out the one 0.5% outlier print from a year ago, the average is…wait for it…2.3%.
But you’ll say, “2.8% is above the Fed’s target!” Yes, but 2.8% is the mathematical consequence of measuring against a rapidly falling inflation a year ago, and the cost to immediately drive inflation to 2% is a lot of job losses (the Fed’s second mandate is full employment). If the Fed doesn’t expect inflation to reach 2% until the end of 2026, why is everyone acting like it needs to be 2% today?
What about tariffs? Tariffs are cognitively easy to grasp, which is why they are so easy to point to as a boost to inflation. But they don’t happen in a vacuum. Let’s say I am selling my Taylor Swift T-shirt for $20 today. Tomorrow, I wake up and decide to change the price to $10,000. Is that inflation? No. Inflation happens after money exchanges hands. Someone has to pay that price in order for there to be inflation. When the price of something spikes, there is a drop in demand that partially offsets the cost increase. Or consumers shift to alternatives.
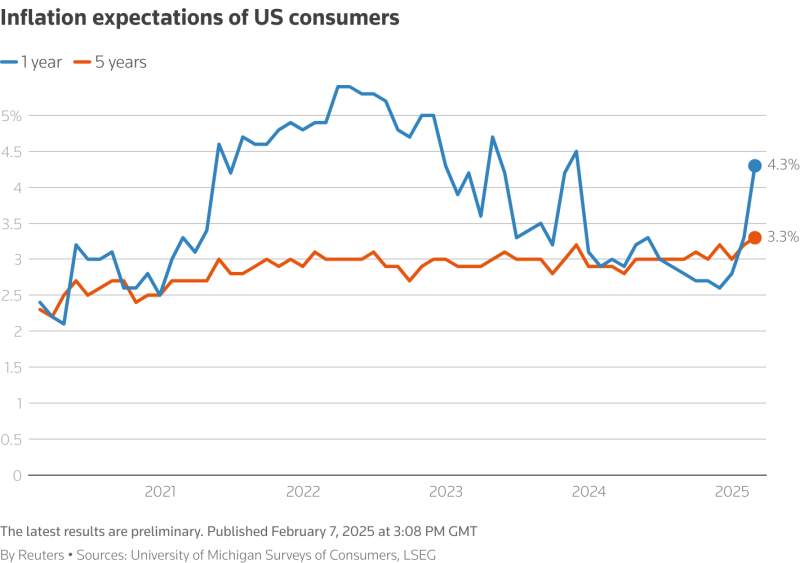
Year-ahead inflation expectations jumped up from 3.3% last month to 4.3% this month, the highest reading since November 2023 and marking two consecutive months of unusually large increases. This is only the fifth time in 14 years we have seen such a large one-month rise (one percentage point or more) in year-ahead inflation expectations.
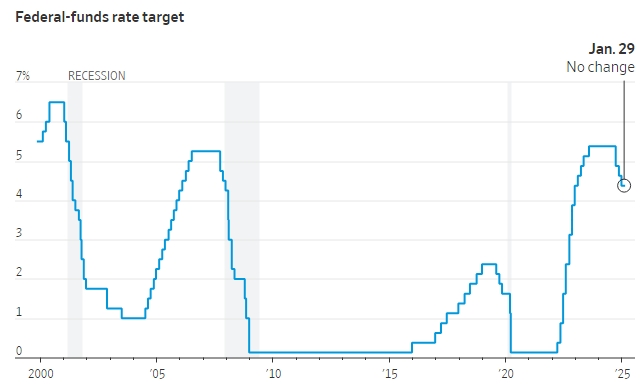
From The Pensford Letter on this week’s Fed decision and press conference (1/29/25):
It’s clear Powell believes there are more rate cuts to come with this quote: “At 4.3%, we’re above everyone’s estimation of neutral. Our eyes are telling us our policies are affecting the economy.”
There were zero mentions about rate hikes.
He was asked what risks might challenge his confidence in the strength of the labor market (causing them to cut rates faster). He first described new hiring as weak and then said: “A spike in layoffs would lead to the unemployment rate going up very quickly because hiring is so low.”
From Powell: “Homeowner’s equivalent rent is steadily coming down now, so we seem to be set up for further progress.”
“We’ve never said we need to be at 2% to cut rates again” and since policy is “meaningfully restrictive” the Fed will cut again before that point.
When asked if inflation needs to be better than forecasted to cut again, he seemed to push back: “The expectation is that we will continue to see inflation progress” which then leads to further easing.
On inflation expectations: “Expectations have ticked up on the front end, but not on the longer end which is what really matters. Inflation expectations remained well anchored”
________________________________________
From Apartment List on the shelter component in the Consumer Price Index:
If you strip out shelter, the remainder of the CPI price basket has increased by just 1.9 percent year-over-year as of December, right in line with the Fed’s long-term 2 percent inflation target. As shelter inflation continues to trend down, it will continue to help improve the overall inflation picture.
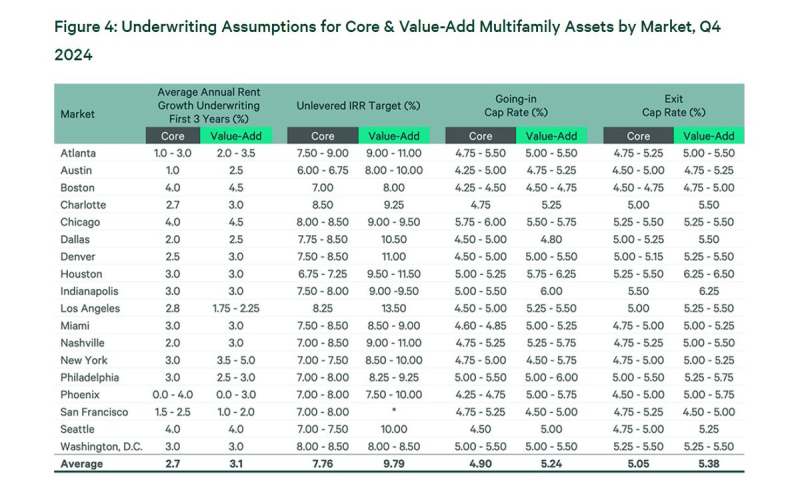
CBRE released their Q4 underwriting assumptions and the cap rates buyers are currently willing to pay while the 5-year and 10-year treasury yields hover around 4.50% are incredibly aggressive.
With Trump’s executive order to open up federal land and waterways, it should put downward pressure on oil prices. A $20/barrel drop in oil (which would put it back in line with Trump 1.0 averages) translates into about a 0.5% in headline inflation readings.
With interest rates now “significantly less restrictive” than they were before last year’s cuts, “we do not need to be in a hurry to adjust our policy stance,” said Fed Chair Jerome Powell.
Powell said the Fed would need to see “real progress on inflation” or unexpected weakness in the labor market before considering further rate reductions.
Powell said they want to see continued cooling of price pressures come true before moving rates down. “We seem to be set up for further progress” on inflation, he said. Being set up for progress is one thing, “but having it is another.”
The national rent index experienced its sixth straight month-over-month decline, falling by 0.20% this month
Year-over-year growth was also negative at -0.5%.
Since the second half of 2022, rent prices have continued to ebb and flow with the seasons as they typically do, but with the overall trajectory trending modestly downward.
This marks the third consecutive winter in which seasonal discounts have been notably sharper than the pre-pandemic norm.
Year-over-year rent growth has now been negative since June 2023.
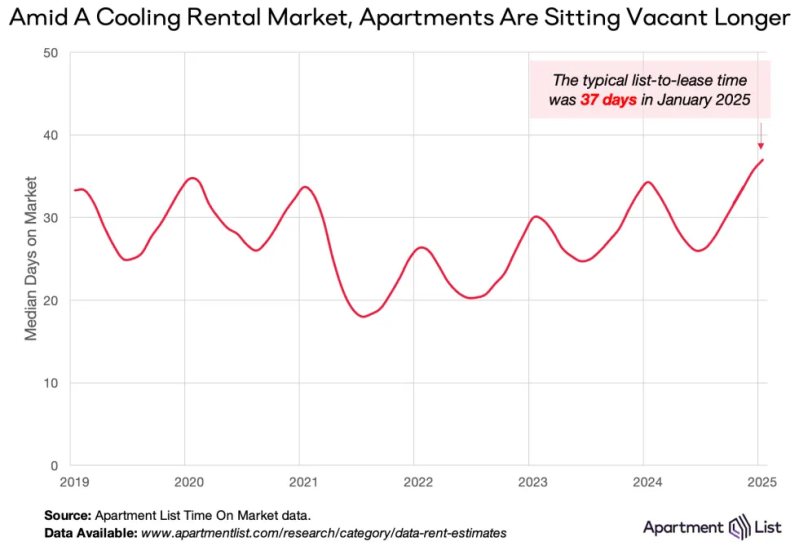
After bottoming out in October 2021, vacancies have been opening up steadily for over three full years. Our vacancy rate ticked up to 6.9 percent, surpassing the previous peak of 6.8 percent to set a new record for the highest reading in the history of this data series, which goes back to the start of 2017.
Among units that were leased last month, the median time on market was 37 days, up from 36 days in December.
The median time on market of 37 days in January is the highest reading that we’ve seen for this metric in any month going back to the start of 2019, when the data series begins. Units are currently sitting vacant for 3 days longer than they were at this time last year, and for 11 days longer than they were in January 2022 when the market was just beginning to loosen.
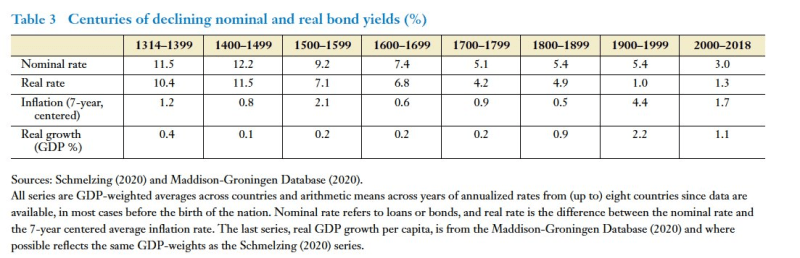
A historical look at interest rates across centuries. Has the 21st century been an anomaly of lower rates or part of a long-term trend of falling rates?
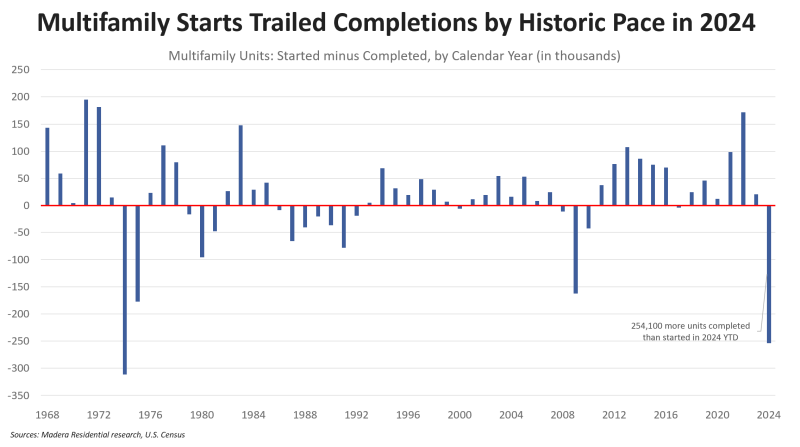
Seeing headlines about a December “surge” (by 62%!) in multifamily construction starts, based on today’s Census data release. It’s a mirage. There is no such spike. It’s just a methodology quirk resulting from how the Census annualizes “seasonal adjustments.” On a NON seasonally adjusted basis, the month of December 2024 came in lower than any December since the pandemic year of 2020. The Census seasonal adjustments always show wild, volatile swings in multifamily starts. It’s never been useful indicator.
CPI has several components that feed directly into Core PCE, so economists always rush to update their PCE forecasts with greater accuracy. WSJ Fed-whisperer Nick Timiraos compiled some revised forecasts for the Fed’s preferred measure of inflation, and the m/m Core PCE is just 0.17%. That annualizes to just over 2%.
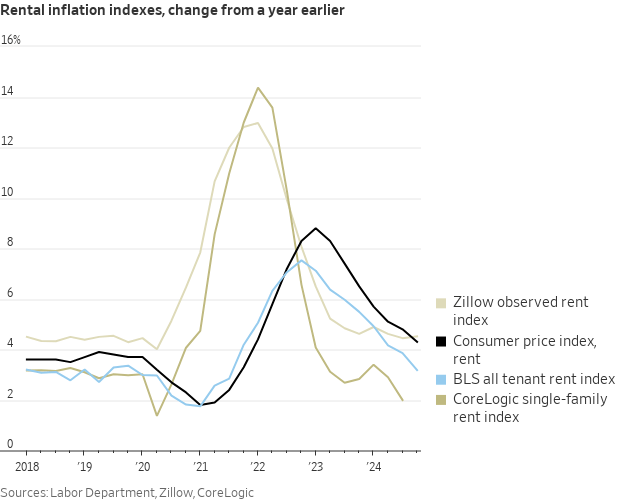
“CoreLogic reports single-family rent growth was up 1.5% for the year, the smallest increase in 14 years. Another data point today suggesting ongoing shelter disinflation is in store for the (lagged) official government measures.”
The Labor Department’s “all tenant rent” index, which leads shelter inflation in the CPI, rose at a much slower pace last quarter. It was up 3.2% over the four quarters ended Q4 (vs. 3.9% in Q3 and 5.5% one year ago). It’s very close to the 3.1% average between 2017-19.”
____________________________________
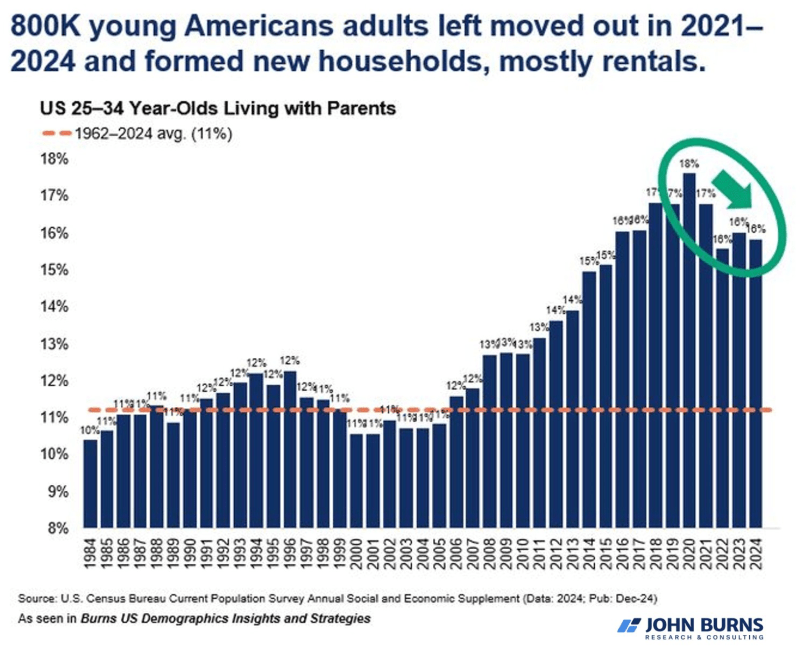
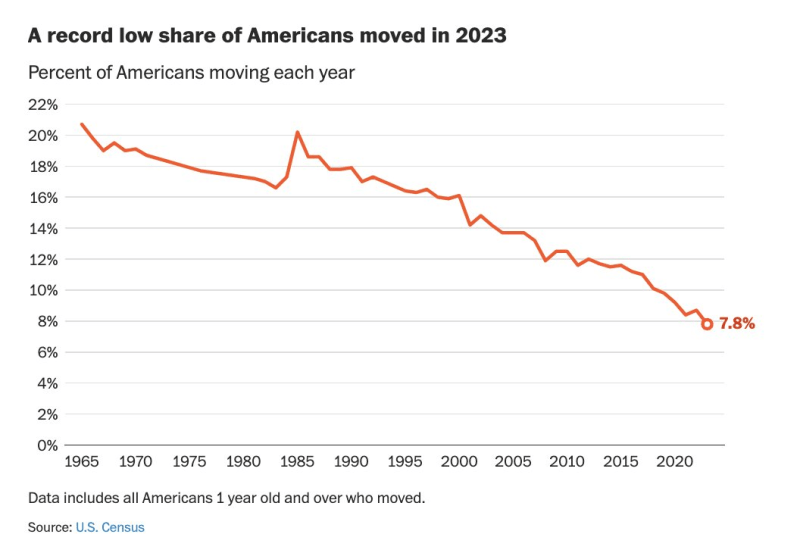
In the ‘Great Stay’ economy, Americans feel stuck. Hiring right now is anemic (esp. outside healthcare & gov) People aren’t moving. Promotions and bonuses are down. People even keep cars for record time. People feel cemented in place.
What it means: A weaker jobs market makes the Fed more likely to cut interest rates.
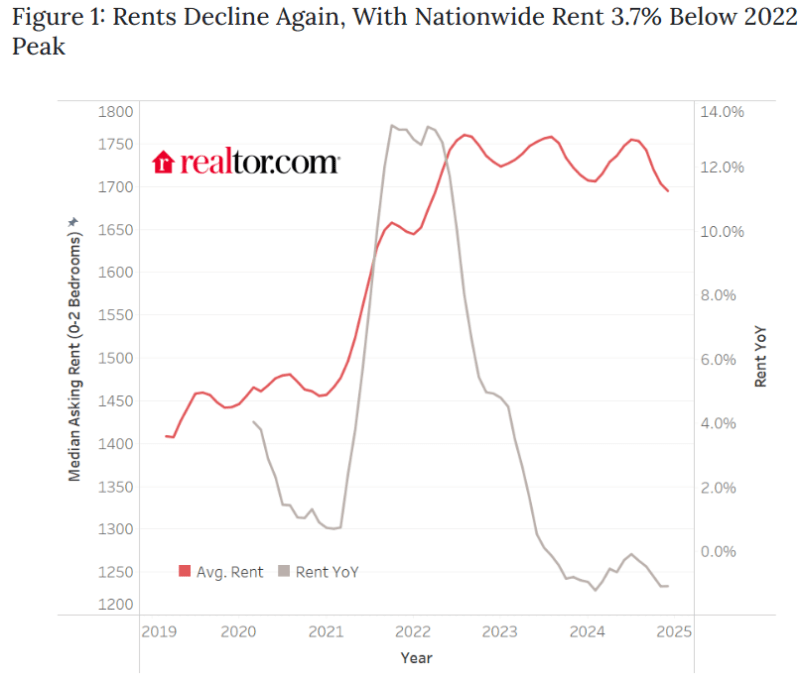
It was the seventeenth consecutive month of year-over-year rent decline for 0-2 bedroom properties.
Rents nationally were down by 1.1% from the previous year.
The median asking rent fell to $1,695, dipping below $1,700 for the first time since April 2022.
Median rent fell consistently across all units of all bedroom counts. Studios were down 1.3% year-over-year, 1-bedrooms and 2-bedrooms were both down 0.9%.
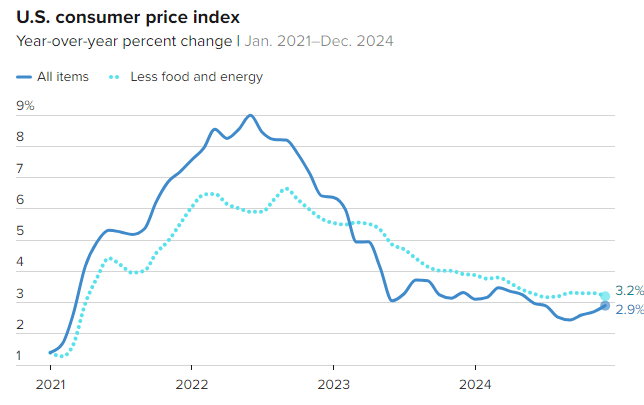
What It Is: Tracks the price change for of a basket of common items people use in their daily lives, such as food, clothing, housing, transportation, and healthcare.
Monthly reading was up 0.4% putting the 12-month inflation rate at 2.9%, in line with market expectations
Core CPI (removing food and energy) was 3.2%, below the previous month and better than the 3.3% the market expected
What It Means: The data coming in slightly better than consensus estimates increase the market odds for Fed cuts in the months ahead
What It Is: Tracks how much businesses are charging for the things they make, before they reach consumers. It’s like looking at the prices in the factory, not the store.
The monthly change was only 0.2% vs. expectations of 0.4%
Core PPI was unchanged month-over-month (0.0%)
What It Means: A cooler than expected PPI report, showing lower than expected inflation, gives the Fed more room to cut rates in the months ahead
Before everyone freaks out that rate cuts are causing the economy to surge, take a look at the monthly NFP averages since covid:
NFP (Non Farm Payroll Report) Monthly Average Of New Jobs: 2021: 604k 2022: 377k 2023: 251k 2024: 186k
Friday’s report showed a gain of 256k jobs – pretty much the average of 2023. Isn’t that a good thing? It’s still 60% lower than 2021. 600k per month is overheated. 250k per month isn’t.
The hiring rate fell to 3.3%, the lowest level since 2013. Professional services hiring is at 2009 levels. Private payrolls averaged 149k last year vs 192k in 2023. Plus, government/healthcare still made up 40% of the jobs – let’s see how that holds up under the DOGE microscope. Call me back in four months after revisions. This feels mostly like positive business sentiment from the Republican sweep. And more like stabilization, not spiking.
The median asking rent fell 0.3% year over year in December to $1,594, the lowest since March 2022
Rents were down 0.1% from a month earlier, and down 6.2% from the August 2022 high of $1,700.
The median asking rent per square foot dropped 1.9% year over year in December to $1.78 and fell 0.1% month over month.
Asking rents fell across all bedroom counts for the sixth consecutive month
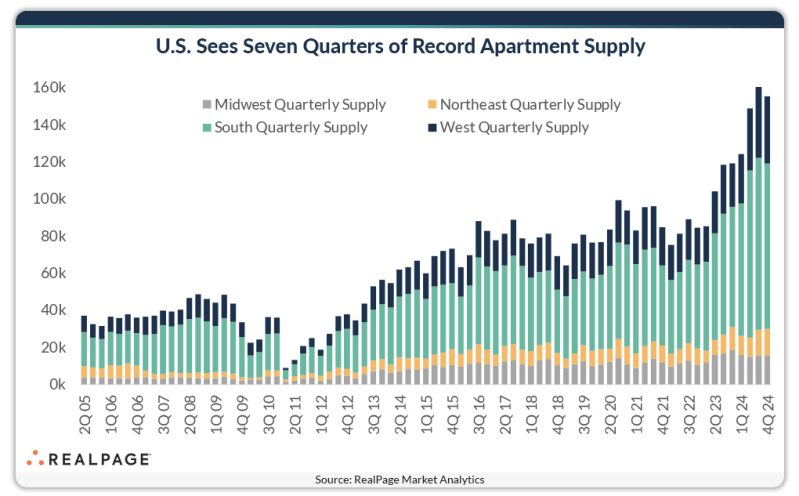
Asking rents have been falling because an influx of supply has left apartment owners with rising vacancies. Apartment completions surged 58.1% year over year to the highest level since 1974 in the third quarter—the most recent period for which data is available. As a result, the vacancy rate for buildings with five or more units rose to 8%, the highest since early 2021.
The future is never the same as the past, but the Fed’s 2.0% inflation target is a level we’ve never hit, other than the anomalous period in the 2010s following the Great Financial Crisis.
________________________________________
The cap rates on single-family investment homes (which have not experienced the price declines of multifamily) are now trading below the 10-year treasury rate.
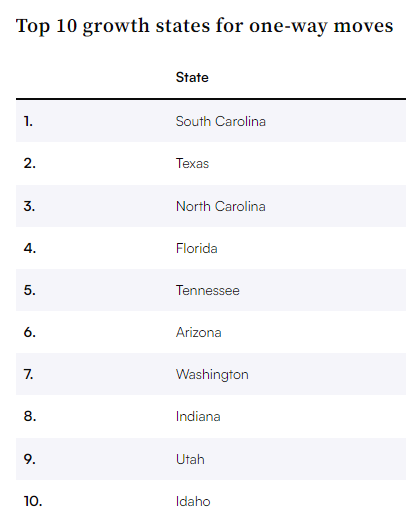
Growth rankings are determined by each state’s net gain (or loss) of customers utilizing one-way U-Haul equipment in a calendar year. The index is compiled from over 2.5 million moving container transactions that occur annually.
South Carolina climbed three spots in the rankings to unseat Texas, which was number 1 the previous three years. It was the first time South Carolina reached number 1 on the rankings, and North Carolina was close behind at number 3.
California experienced the greatest net loss of do-it-yourself movers, and ranked 50th for the fifth consecutive year in 2025, followed by Massachusetts, New Jersey and New York.