As of 2nd quarter 2025, Class A rental rates were up 2.3% year-over-year, while Class B stock grew 0.8% (less than the U.S. average). Class C stock continues to see rent cuts of 1.1%.

Source: RealPage
As of 2nd quarter 2025, Class A rental rates were up 2.3% year-over-year, while Class B stock grew 0.8% (less than the U.S. average). Class C stock continues to see rent cuts of 1.1%.
Source: RealPage
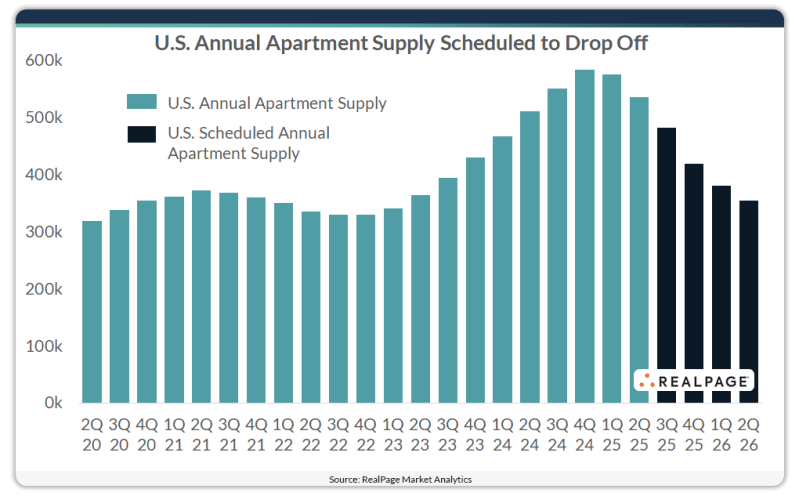
In the U.S. overall, just over 354,000 units were under construction at the end of 2nd quarter and scheduled for completion in the coming year. That is a 33.9% decline from the roughly 535,800 units completed in the year-ending 2nd quarter 2025.
Source: RealPage
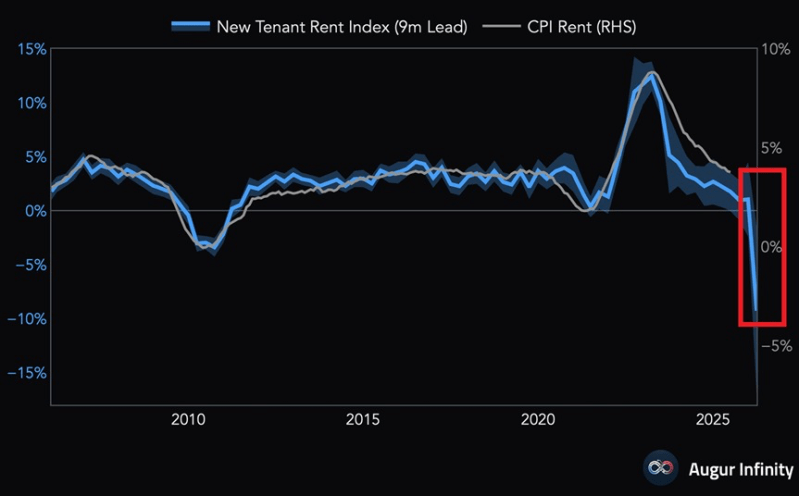
The BLS’ New Tenant Rent Index fell 9.3% year-over-year through the end of Q2 2025. This data tracks what is happening with rents much closer to real time and tends to lead the shelter component of CPI (which tracks the rental market on a significant lag and uses a concerning amount of survey data).
If the CPI’s shelter component “catches down” to the New Tenant Rent Index it would provide significant downward pressure on CPI prints in the coming months.
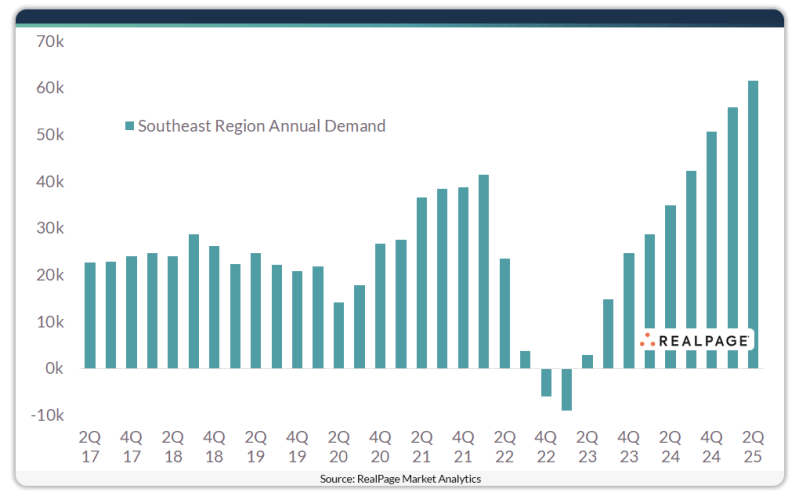
Annual absorption topped 60,000 units in the Southeast in the year-ending second quarter. That was the region’s strongest apartment demand reading in decades. The Southeast has been enjoying an outsized performance relative to other regions, inspired by solid in-migration, resilient job growth and affordability advantages.
Source: RealPage
From Jay Parsons: It’s not just interest rates. Sales volume has remained weak because sellers and buyers are both bullish on multifamily. Sellers want to price in the rebound that buyers are counting on.

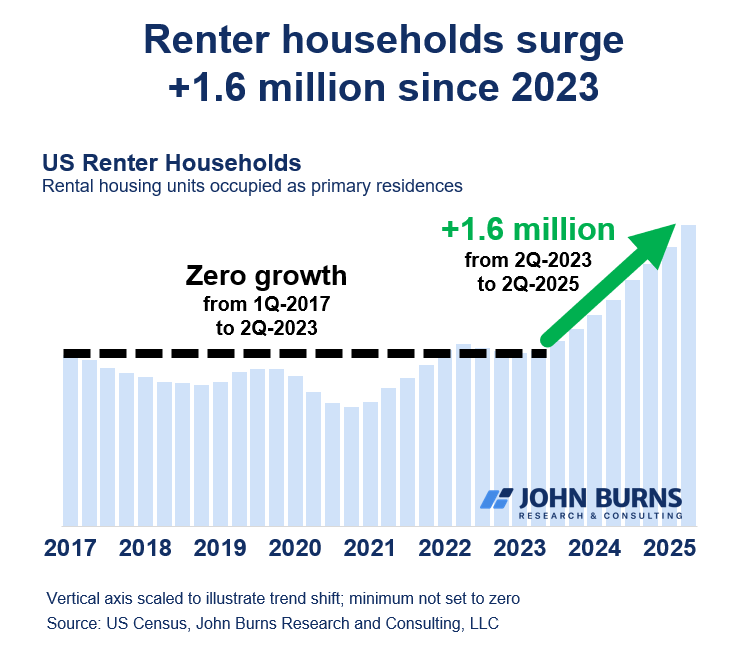
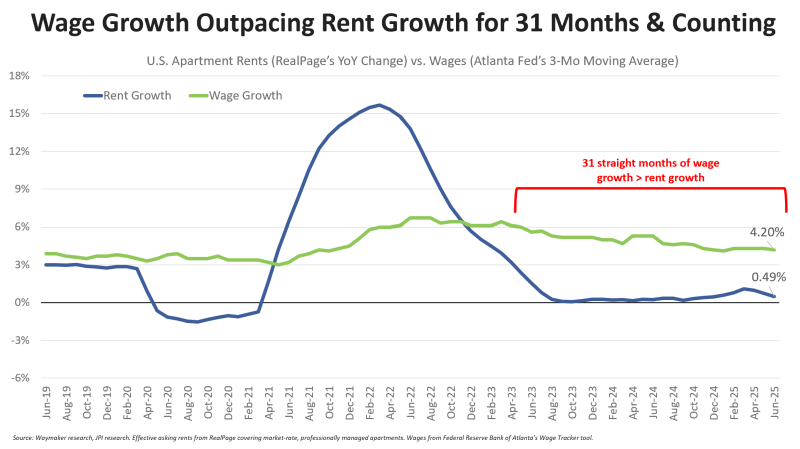
Wage growth has outpaced apartment rent growth for 31 consecutive months, which helps explain why we’ve had extremely strong absorption data.
Source: Jay Parsons
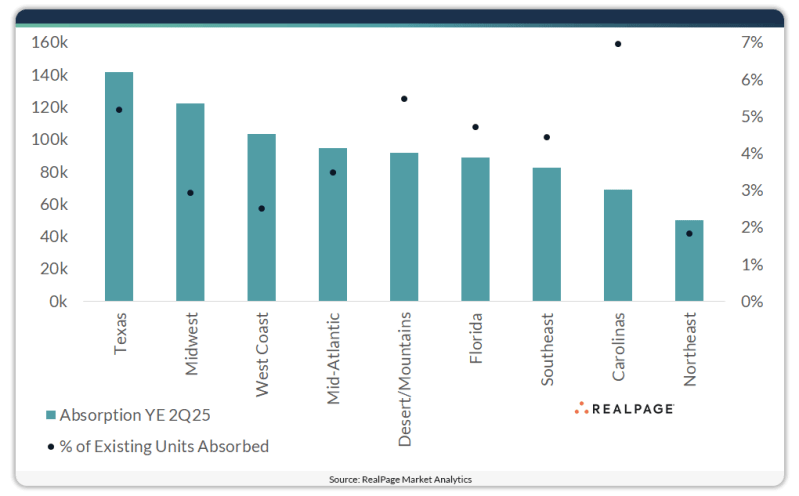
The Carolinas absorbed over 69,200 units in the year-ending 2nd quarter, which was a record for the region and more than double the five-year average.
When looking at demand as a share of the region’s total existing unit count, the Carolinas came out notably ahead of the nation’s other regions. The Carolinas had 995,200 existing apartment units as of 2nd quarter, which was the smallest volume nationwide. That means the past year’s demand total represents 7% of the Carolinas region’s existing stock of apartments.
Source: RealPage
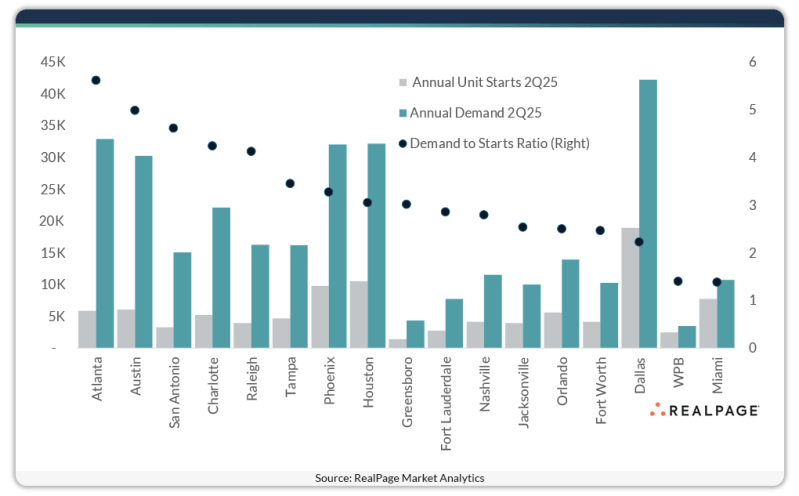
Across the U.S., apartment demand keeps climbing just as building starts have plummeted. In the year-ending 2nd quarter, nearly four more apartments were absorbed than started, with nearly 800,000 units absorbed, compared to about 215,000 units started. That was an increase from the already solid ratio of 3.4 from the 1st quarter. Charlotte and Raleigh had demand-to-starts ratios between 4.1 and 4.6.
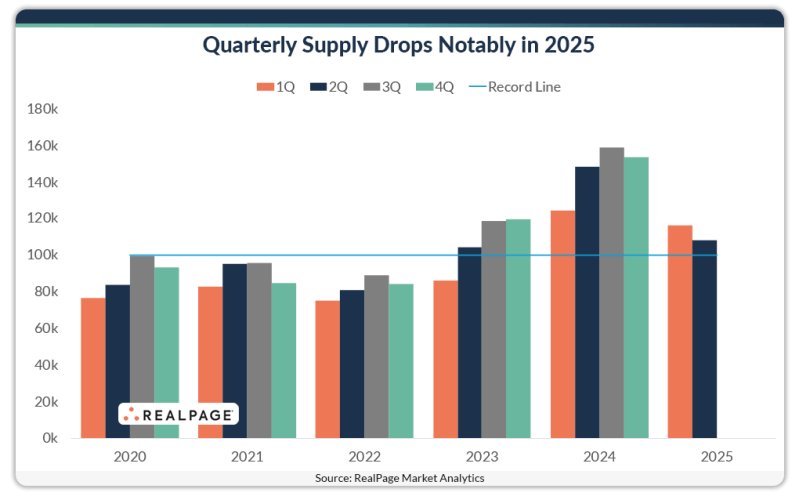
Apartment supply volumes remain elevated, though completions continued to drop in 2nd quarter 2025.
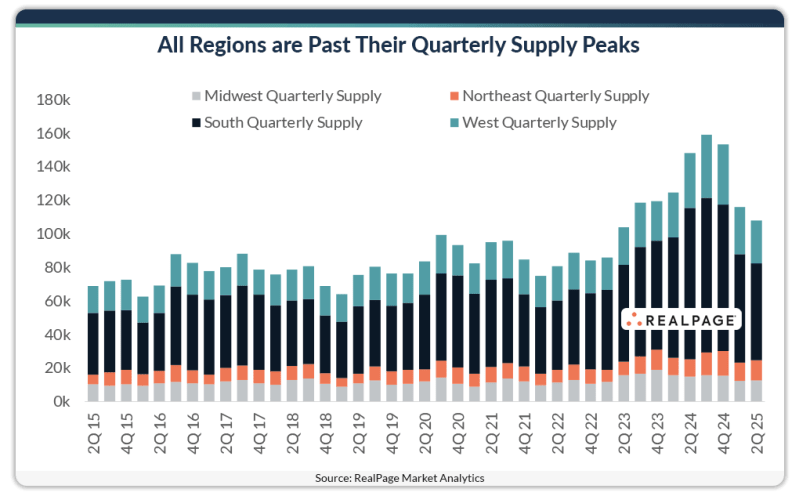
The South saw the steepest pullback, delivering roughly 6,900 units less than in the first three months of 2025 and even fewer than the peak achieved in 3rd quarter 2024.
Source: RealPage
