Monthly and annual price changes through October:
| Data Source: | Data Month: | MOM Change: | Annual Change | Data Release: |
| Green Street | Oct 2023 | -8.60% | -14.00% | November |
| MSCI | Oct 2023 | -1.00% | -12.60% | November |
| Average: | -4.80% | -13.30% |
Monthly and annual price changes through October:
| Data Source: | Data Month: | MOM Change: | Annual Change | Data Release: |
| Green Street | Oct 2023 | -8.60% | -14.00% | November |
| MSCI | Oct 2023 | -1.00% | -12.60% | November |
| Average: | -4.80% | -13.30% |
Monthly and annual rent changes through October:
| Source: | Month: | Monthly Change: | Annual Change: | Vacancy: | Data Release: |
| Apartment List | Oct | -0.70% | -1.20% | 6.40% | 10.30.23 |
| Apartments Advisor | Oct | -0.52% | -0.48% | N/A | 11.1.23 |
| CoStar | Oct | -0.47% | 0.74% | 7.15% | 11.1.23 |
| Apartments.com | Oct | -0.40% | 0.70% | N/A | 11.7.23 |
| Redfin | Oct | -1.60% | -0.30% | N/A | 11.8.23 |
| Zillow | Oct | -0.10% | 3.20% | N/A | 11.8.23 |
| Yardi Matrix | Oct | -0.20% | -0.40% | 5.10% | 11.16.23 |
| Rent.com | Oct | -1.64% | -0.29% | N/A | 11.20.23 |
| Realtor.com | Oct | -1.03% | -0.35% | N/A | 11.28.23 |
| Average: | -0.74% | 0.18% | 6.22% |
The S&P CoreLogic Case-Shiller U.S. National Home Price NSA Index, covering all nine U.S. census divisions, reported a 3.9% annual change in September (which is an average of July, August and September closing prices), up from a 2.5% change in the previous month.
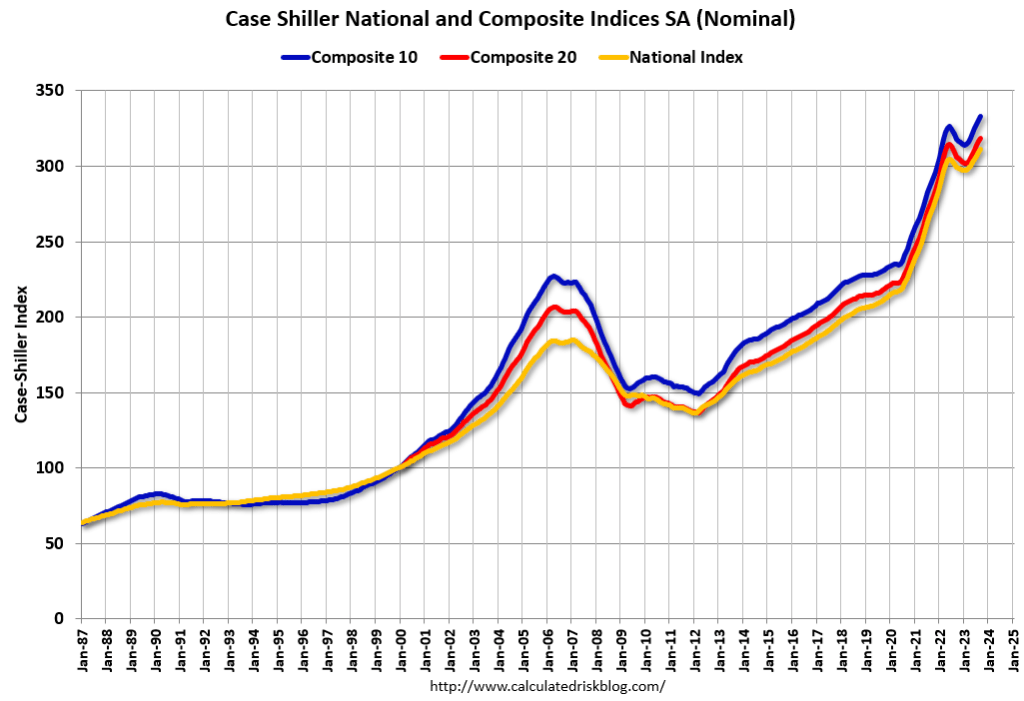
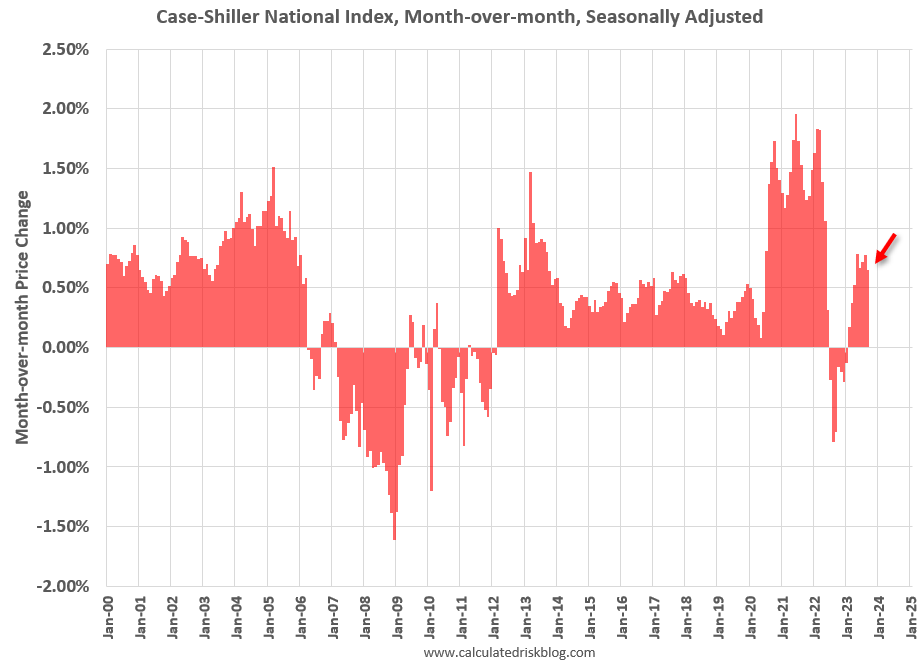
The month over month increase was at 0.65%. This was the eighth consecutive month-over-month increase following seven straight month-over -month decreases.
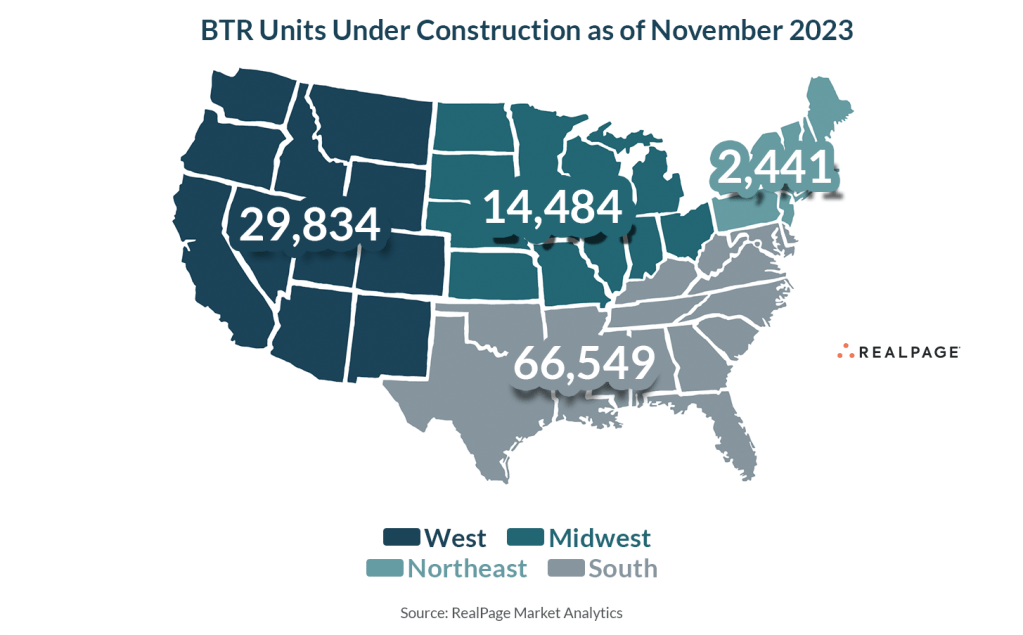
Multifamily starts fell 32.8% year over year in October, with permits pulled falling 27.8%. Completions rose to 408,000 in October, a 14.3% increase.
Construction starts peaked in May of this year and that new supply will continue to hit the market through 2024-2025. Yardi projects 487,512 new units will deliver in 2023 with 536,145 expected in 2024.
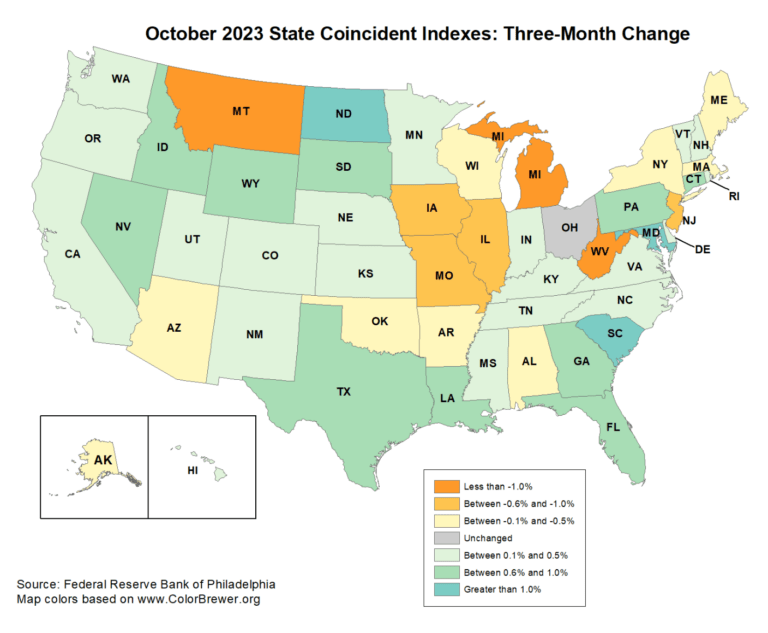
Coincident indicators include employment, real earnings, average weekly hours worked in manufacturing and gross domentic product (GDP).
South Carolina is slowing the fastest at greater than 1.0%. North Carolina is slowing between 0.1% to 0.5%.
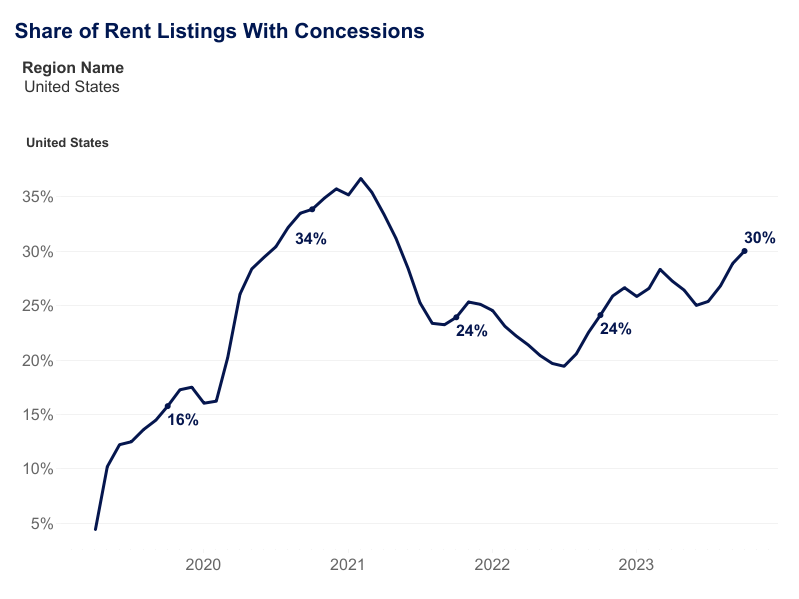
Concessions include free months of rent and/or parking.
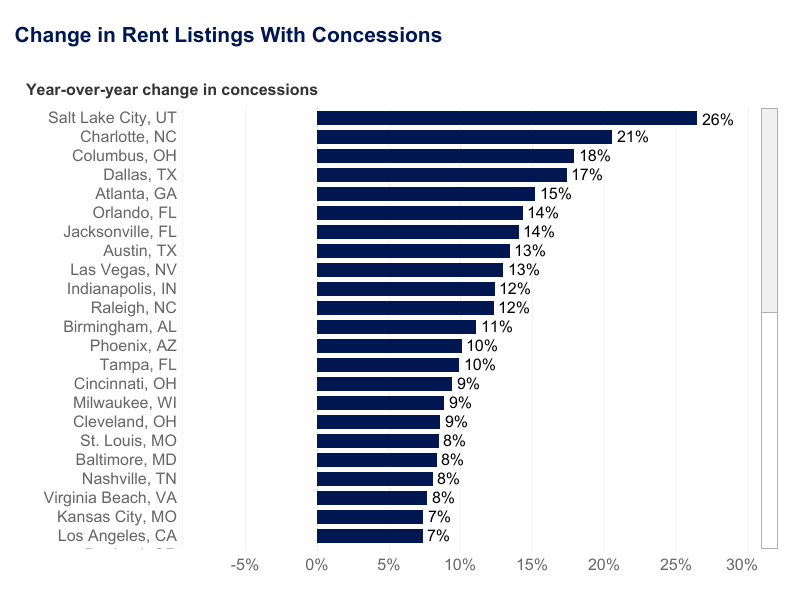
These are the markets showing the largest increase in concessions:
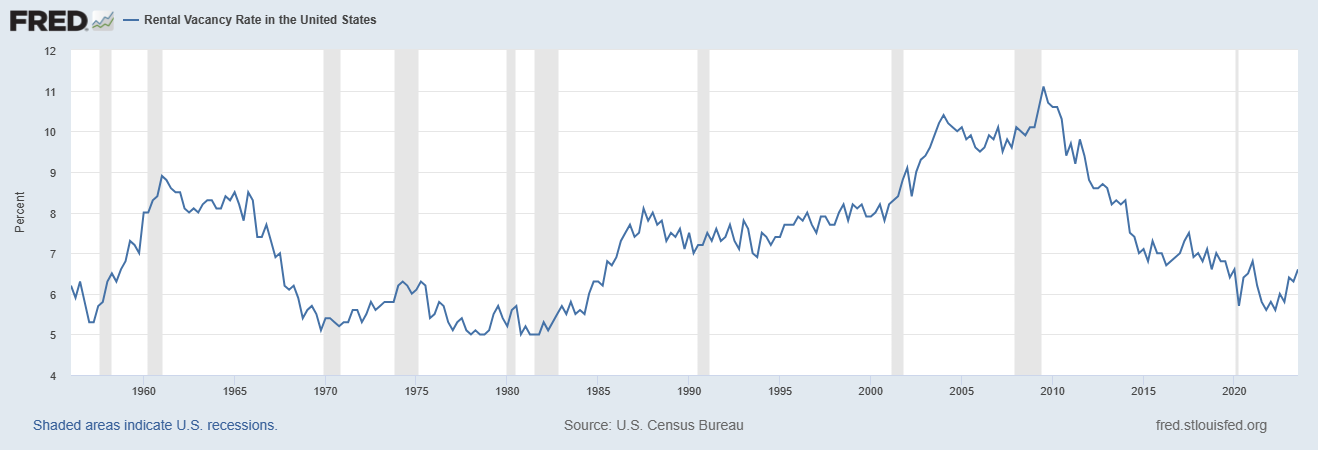
The concessions come at a time when vacancy rates are rising across the U.S.
They will each be capped at $70 billion, however, workforce housing will be exempt from their lending limits.
Workforce housing is defined as developments that adhere to state or local housing affordability initiatives for at least 10 years of the loan term. In regions that aren’t cost-burdened, the threshold for affordability is 80% of the area median income or below. Cost-burdened markets can qualify with rents at 100% of AMI, with some up to 120%. Only 18.6% of their loans fit within those income limits in 2022.
Fannie and Freddie have $75 billion in loan limits in 2023, and they were only at $32 billion and $41 billion at the end of Q3.