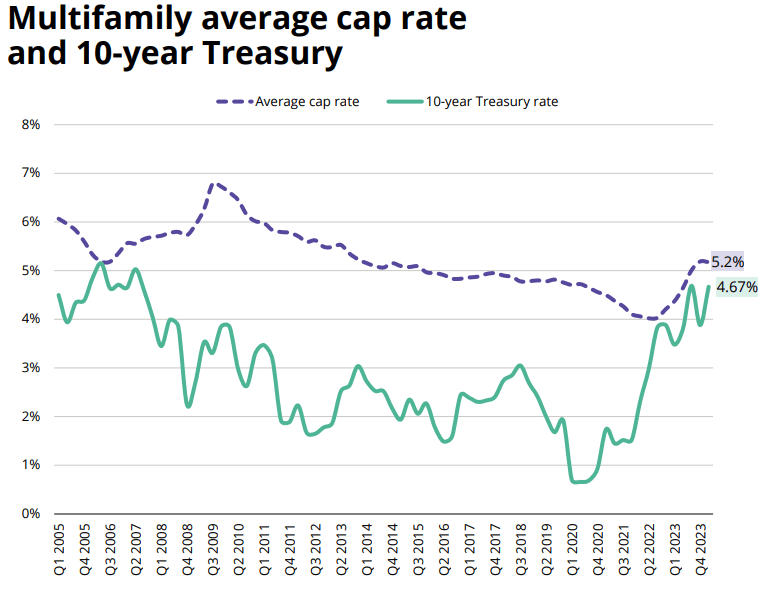
Cap rates and the 10-year treasury do not always move in lockstep. In 2006, cap rates and the 10-year converged just above 5% (almost exactly where cap rates are today).
Over the next 4 years, cap rates rose to almost 7% while the 10-year treasury moved below 3%.
Cap rates reflect sentiment toward real estate. In 2009, rents and multifamily property prices were falling as many tenants lost their jobs and were unable to pay. Buyers required a higher return to take on what they perceived as higher risk.
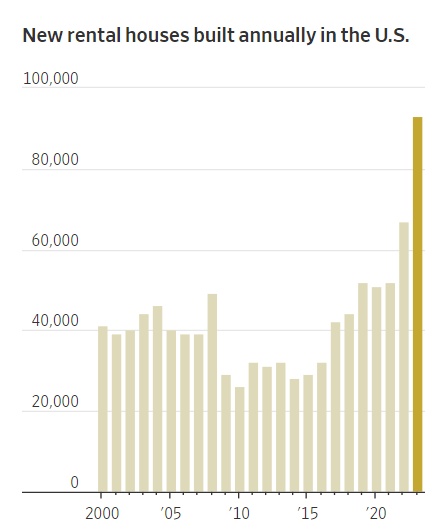
In 2023, 93,000 new single-family homes for rent were completed. That was 39% more rental homes than in 2022, and the most in any year ever. The breakneck pace is poised to continue this year before easing by 2025.
In March of this year, the average monthly mortgage payment had ballooned to 38% more than the average monthly apartment rent. Rents for new houses often fall somewhere in between.
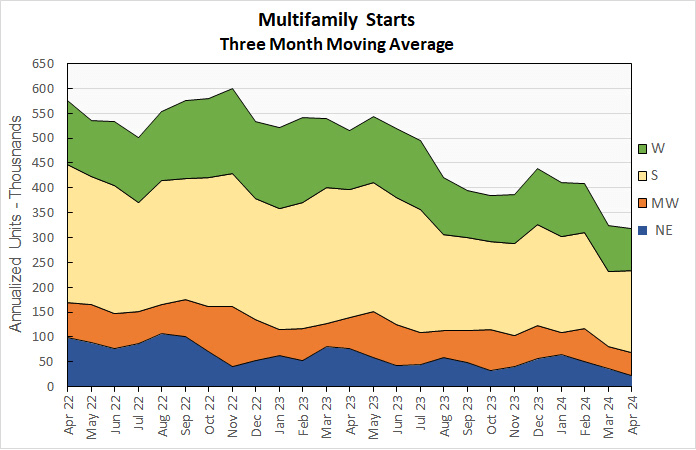
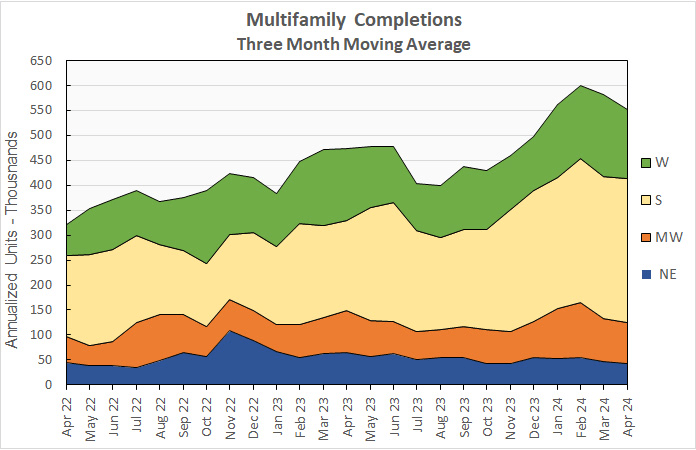
The data below uses a three-month weighted moving average and color codes by region (West, South, Midwest and Northeast):
Through the first four months of the year, completions (properties that started the construction process in 2020 – 2022) have significantly outpaced new starts.
Current Class A tenants move into the brand-new Class A buildings that are offering rent concessions. Class B tenants move up to Class A apartments, and Class C tenants move up to Class B apartments. Everything trickles up, leaving Class C buildings cutting rents the most to try and attract tenants.
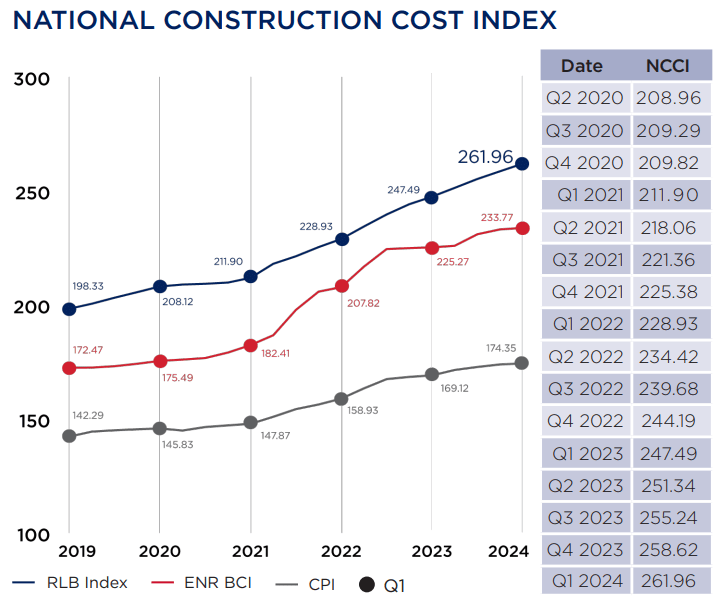
The latest RLB quarterly cost report, with data current to mid-Q1 2024, shows that the national average increase in construction costs was 1.29 percent, which is similar to pre-pandemic levels. This compares to 5.85% year-over-year.
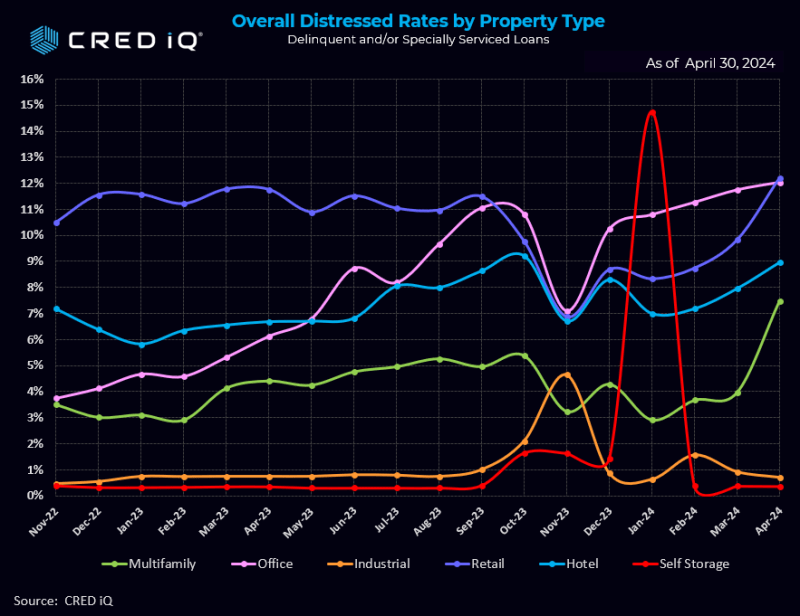
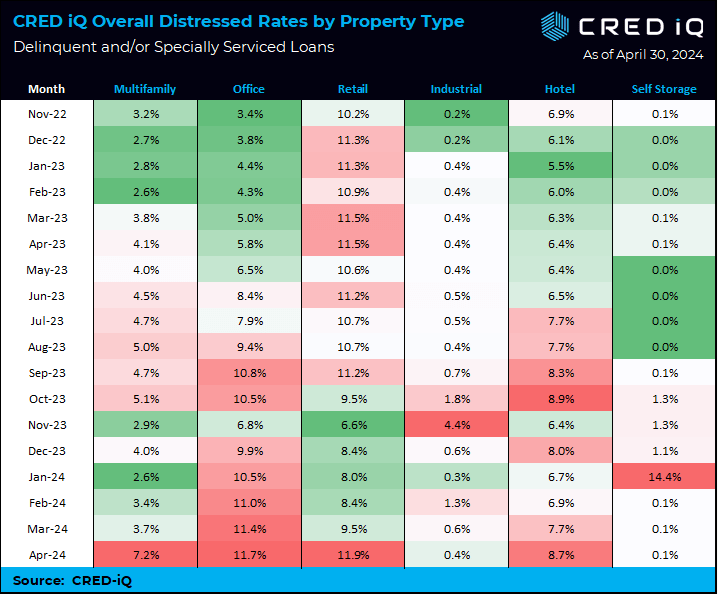
CRED iQ’s distress rate for all property types increased from 7.61% to 8.35%, a 74 basis points jump in April. Multifamily saw a whopping increase distress rate increase – from 3.7% in the March print to 7.2% in April. The increase is mostly attributable to a $1.75 billion loan ($561,000/unit) backed by Parkmerced, a 3,221-unit multifamily property in San Francisco.
CRED iQ’s distress rate aggregates the two indicators of distress – delinquency rate and specially serviced rate – yielding the distress rate The index includes any loan with a payment status of 30+ days or worse, any loan actively with the special servicer, and includes non-performing and performing loans that have failed to pay off at maturity.
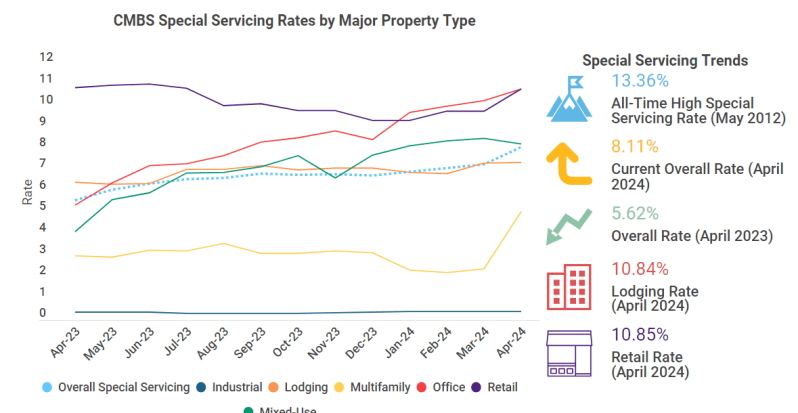
The Trepp CMBS Special Servicing Rate leaped in April, rising 80 basis points to reach 8.11%. This marks the largest monthly jump that the rate has experienced in nearly four years, with higher monthly upticks only reached during the COVID-19 pandemic in mid-2020. The biggest movers were by far ‘Other’ properties and multifamily (yellow line), which increased a whopping 236 basis points and 269 basis points, respectively.
And From Bloomberg:
CRE CLO issuance surged to $45 billion in 2021, a 137% increase from two years earlier, when buyers of apartment blocks sought to profit from the wave of workers moving to the Sun Belt from big cities. Three-year loans would give them time to complete upgrades and refinance, the thinking went.
Fast forward to today and the debt underpinning many of the bonds is coming due for repayment at a time when there’s less appetite for real estate lending, insurance costs have skyrocketed and monetary policy remains tight. Hedges against borrowing cost increases are also expiring and cost significantly more to purchase now.
Those blows helped increase multifamily assets classed as distressed to almost $10 billion at the end of March, a 33% rise since the end of September, according to data compiled by MSCI Real Assets.
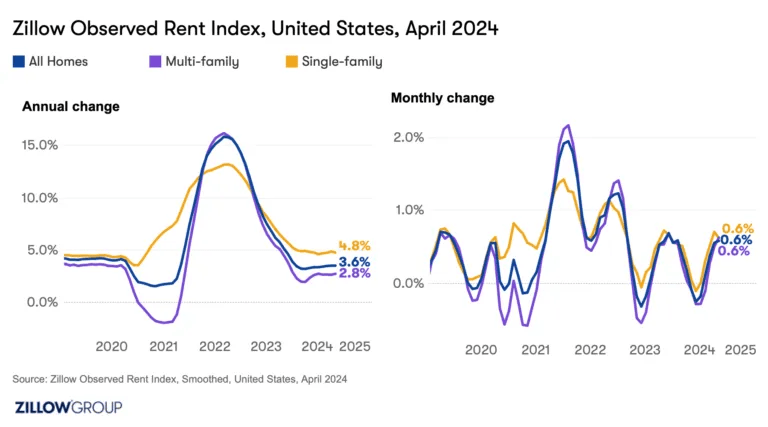
For the first time since July 2023, typical rent for multifamily units outpaced typical rent for single-family homes on a monthly basis, even if you need to squint to notice the difference. Multifamily rents grew 0.631% in April, while single-family rents grew 0.625%.
Over the past year multifamily rents rose only 2.8%, well below the 4.8% year-over-year growth seen in single-family rentals.
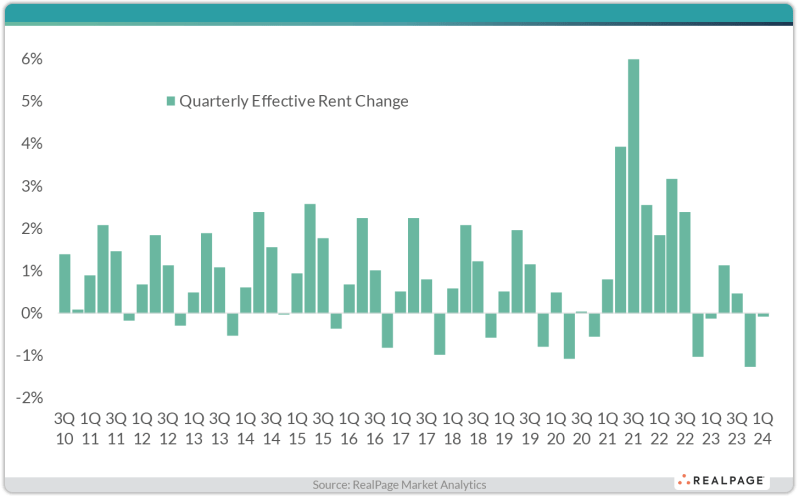
Effective asking rents in the U.S. overall fell by 0.1% in the January to March time period. That was a notable difference from the pre-COVID norm, which was growth of 0.6% during 1st quarter.