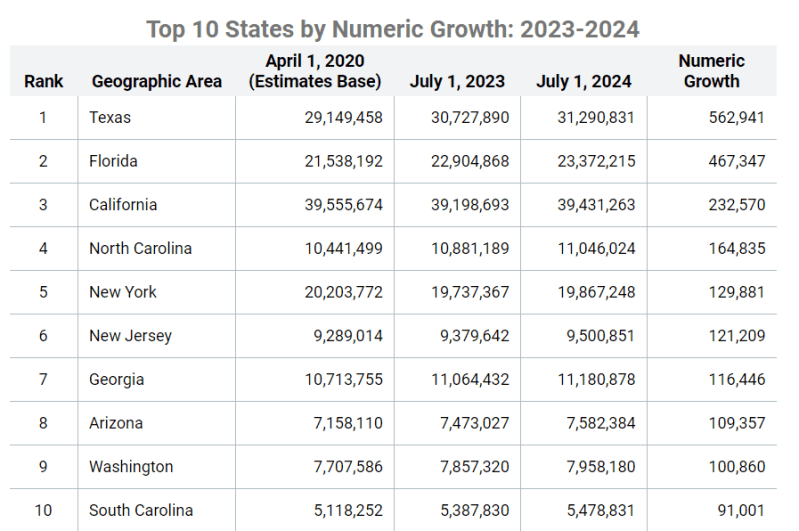
The U.S. Census Bureau released the 2024 population growth statistics this week.
Total U.S. Growth:
Net international migration, which refers to any change of residence across U.S. borders (the 50 states and the District of Columbia), was the critical demographic component of change driving growth in the resident population. With a net increase of 2.8 million people, it accounted for 84% of the nation’s 3.3 million increase in population between 2023 and 2024. This reflects a continued trend of rising international migration, with a net increase of 1.7 million in 2022 and 2.3 million in 2023.
Natural increase also contributed to the population growth, as births outnumbered deaths by nearly 519,000 between 2023 and 2024. This marks an increase from the historic low in 2021 when natural increase was just over 146,000, but it was still well below the highs in prior decades.
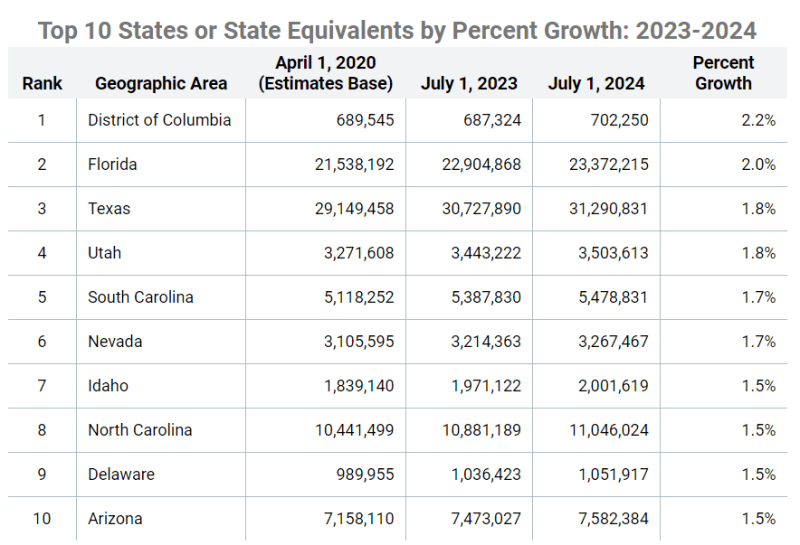
The South:
At nearly 132.7 million residents, the South is the most populous region. With a population gain of nearly 1.8 million — a change of 1.4% between 2023 and 2024 — the South added more people than all other regions combined, making it both the fastest-growing and largest-gaining region in the country.
The largest contributing component to this growth was international migration, which added 1.1 million people. Domestic migration netted another 411,004 residents. The South was the only region with positive net domestic migration, where the number of people entering the region exceeded those leaving. Natural increase also contributed 218,567 to the growing region.
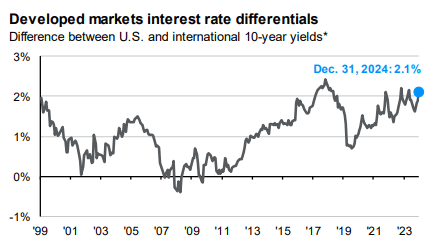
From J.P. Morgan’s Q1 2025 Guide To The Markets, a nice visual of how much higher the 10-year treasury is in the United States is vs. the rest of the developed world. This makes U.S. bonds look more attractive to investors and helps keep a cap on yields:
From J.P. Morgan’s 2025 Eye On The Market, for those concerned about a reduction in Federal employment impacting multifamily renters, the 3 million federal workers employed are the lowest level as a share of US employment in 85 years (about 2%).
2025 Prediction #1 – The 10 Year Treasury Will Finish Below 4%
The 10T is oversold here. Inflation is contained enough to not be the main event.
Growth will slow – Republican policies won’t really have much impact until 2026
Labor Labor Labor Labor Labor
Most of the globe is dealing with tepid or negative growth (cough cough Germany and China)
Real rates
It’s important to remember that the US Treasury market is the world’s mattress. It behaves differently than any other asset in the world. Central banks, financial institutions, pensions, etc all have mandates that require a certain amount of Treasury holdings. Heck, our own Fed mandates Primary Dealers bid on Treasuries at every auction.
Here are the Top 10 bond markets in the world. What’s the realistic alternative to the US? Countries 2-10 combined equal US market size. Japan and China are both yielding sub-2%, are you dying to snatch those up? I want to be in the room when you pitch buying Brazilian bonds because they are yielding 7%.
The UK has a similar yield but is 1/10th the market size, so there’s only so much money that can flow into that market. And, it’s still just the same yield – it’s not an improvement over the mattress. And their economy is contracting. Maybe global yields don’t drive US yields lower, but they certainly keep a lid on them. Speaking of keeping a lid on yields, Real Rates will likely do the same at current levels. The higher the real rate, the more attractive the return. Real Rates are just yields adjusted for inflation.
While those keep a lid on rates, they don’t necessarily drive them lower. So why do I think the 10T will finish 2025 below 4%?
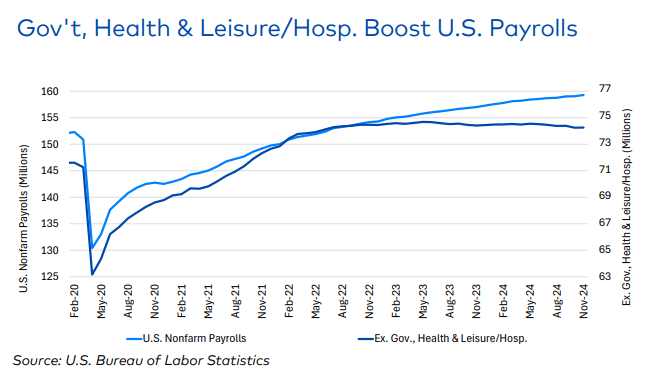
Even if markets continue to react to NFP as if it’s gospel, you have learned it’s garbage noise. Plus, over half of the gains are from government/healthcare. What happens when a new administration, hell bent on reducing government spending, stops hiring government positions? Or requires government workers to return to office?
Month after month, we see big downward revisions. The last annual revision added a further downward revision of over 800k. The QCEW, generally considered the most accurate job report (but with a terrible lag), continues to diverge substantially from the headline NFP reports. For the love of all that is holy, stop reacting to the NFP report!
But let’s say you think I’m an idiot and believe NFP is a great indicator of overall labor market health. Here’s the monthly NFP average over the last three years.
2022: 413k 2023: 238k 2024: 190k
Remember, 0 isn’t the Mendoza line. Somewhere around 125k is to keep pace with population growth. In other words, NFP below 125k is contractionary. Household Survey (UR) last month showed a loss of 355k jobs while NFP showed a gain of 227k. Someone’s lying. Other fun labor market stuff…
Unemployment Rate – up from 3.4% to 4.2%.
Continuing Claims – up 600k from the first hike and at its highest level in over 3 years. The median unemployment timeline is now 10.5 weeks.
JOLTS – job openings down to 7.7mm from over 12mm.
Unemployment to Employment Flow Index – this measures unemployed people finding employment and is at its lowest level in a decade.
The labor market is in decent shape, but it’s not overheated. More importantly, the trend is worrisome. The labor market, more than anything else, will dictate Fed policy and interest rates in 2025.
2025 Prediction #3 – The Fed Will Cut at Least 0.75%
This time last year, the Fed projected 0.75% in cuts in 2024. It ultimately delivered 1.00%. I think the Fed misses by at least one cut again. It is projecting 0.5%, but I think it will be at least 0.75%. That would put Fed Funds around 3.62% this time next year. It’s important to remember the 0.5% assumes no further economic deterioration. The Fed believes rates are still restrictive, so rate cuts are just easing off the brakes to avoid bringing the economy to a screeching halt. Even with a strong economy, the Fed will continue us on a path towards neutral. And if I’m right about the labor market, it will cut faster to preserve jobs. What would it take for the Fed to deliver fewer than 0.5%? Some combination of un-worrisome jobs data and worrisome inflation data.
2025 Prediction #4 – Core PCE Will Average Below 3%
China is exporting deflation. Not disinflation, deflation. In Trump 1.0, tariffs didn’t get enacted until the end of his first year. I think those are a concern for next year. Oh, and that laggy Shelter component will continue to exert downward pressure throughout the year. Inflation progress might be slow and even temporarily stall, but that’s not the same as reaccelerating. If the target was 3% instead of 2%, wouldn’t the narrative be entirely different? Just like early 2024, we may get some worrisome reports early in the year. Ride out the media storm and on the far side of it is an inflation story that is still mostly good.
If you remove government and hospitality/leisure jobs from the payroll reports, jobs have been stagnant and declining for over 2 years. The new administration’s focus on cutting government spending could slow government job growth and provide room for the Fed to cut rates more dramatically.
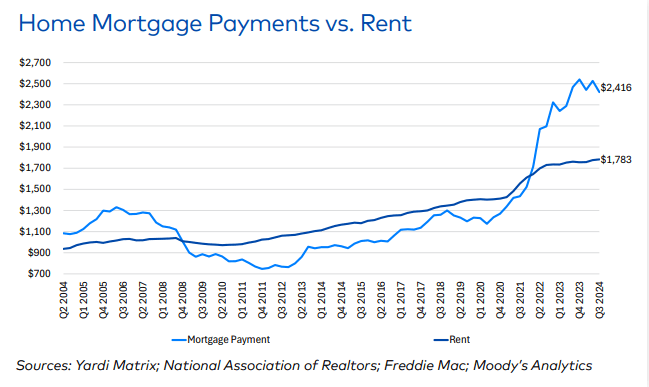
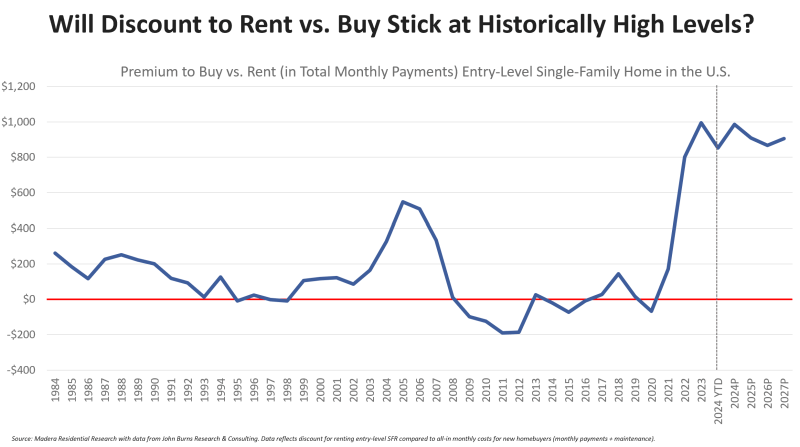
The cost to purchase a home vs. renting remains at a historically high, a tailwind for rent prices entering 2025:
Lower vacancies, higher rents – The last few years have seen historic levels of new apartment construction, but that’s begun to ease. According to CBRE, multifamily construction starts should be 30% below pre-pandemic averages by mid-year. For that reason, 2025 should begin to bring about lower vacancies and 2.6% higher rents in the midst of continued strong renting demand.
Growing apartment appeal – Uncertainty gripping the housing market and a cloudy interest rate picture is leading many would-be home buyers to pick renting instead of purchasing. Benefits traditionally associated with renting –flexibility, freedom from maintenance, opportunities to meet new friends – will be prioritized by those who in earlier generations likely would have been home buyers. The trend is reflected in the National Association of Realtors Profile of Homebuyers and Sellers, revealing median home buyer age has risen from 35 to 38. It’s also seen in Entrata’s New American Dream Report, divulging that 66% of renters report renting rather than homeownership is a better lifestyle match for them.
AI spurs personalization – As AI continues to mature in the year ahead, the repetitive tasks traditionally undertaken by multifamily community property managers and staff will increasingly be assumed by technology. That should liberate apartment community employees to attend in more personalized ways to residents’ preferences. The coming year should witness a surge in new apartment community amenities, such as community concierge services, that will enable residents to build more robust social ties with fellow residents and staff.
U.S. banks will face continued pressure from commercial real estate (CRE) in 2025, but stresses and potential losses are expected to remain within ratings sensitivities for most lend, as loan loss reserves should insulate bank performance and ratings.
The largest banks with assets over $100 billion have reported the highest levels of non-performing non-owner occupied CRE loans and charge-offs. However, overall relative exposure is much lower than for regional and mid-sized banks.
Credit losses are not likely to burden earnings in 2025. Most Fitch-rated banks have been proactively reserving against potential office CRE losses, while the large banks also benefit from diversified business models.
_____________________________________________
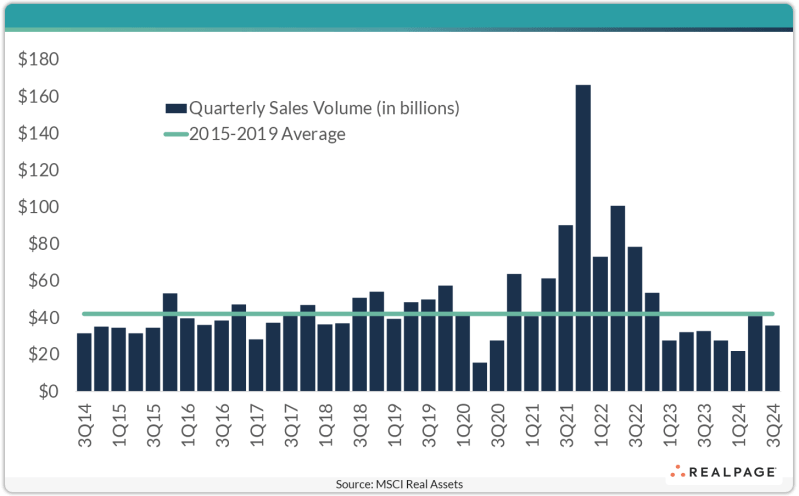
Third quarter multifamily volume saw the highest levels since 2022. Year-to-date volume was up 8.5% through Q3.
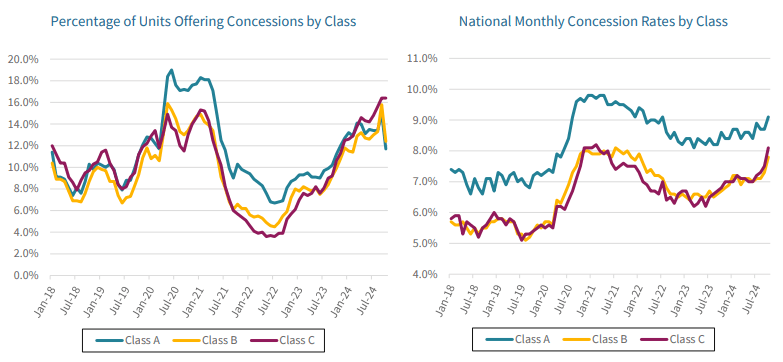
13.4% of all units offered concessions in October 2024, up from 10.4% in October 2023
The value of concessions has risen from 7.4% of asking rent in 2023 to 8.2% in 2024 (about equal to a month’s free rent)
Over the past year, as demand has been relatively softer, the value of concessions for class A units increased slightly, up to 9.1% in October 2024 from 8.6% in October 2023. The share of class A units offering concessions has also risen, albeit slightly, to 11.7% as of October 2024, up from 11.2% a year ago.
The continued softer demand for apartments seen over the past year is even more evident in the skyrocketing percentage of units offering concessions in class B and especially class C units. These concession metrics increased considerably over the past year and are close to levels seen during the pandemic for class B and C units. As of October 2024, 12.4% of class B units were offering concessions, up from 9.9% in October 2023, and a remarkable 16.4% of class C units were offering concessions, up from 10.6% a year ago.
The latest commercial property price report from MSCI Real Capital Analytics said that multifamily property prices fell 0.3 percent from their level of the month before, and prices were down 5.7 percent from their level of one year ago. Prices are now down 20.4 percent their peak in 2022.
_________________________________________
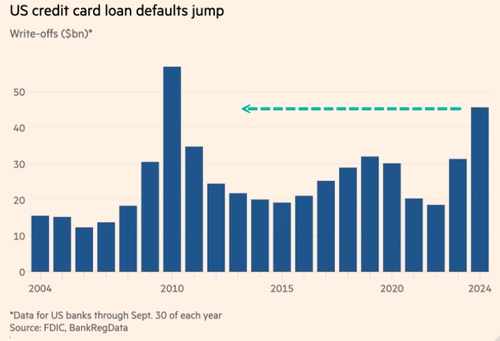
U.S. credit card defaults have soared to levels not seen since 2010, coming out of the Great Recession. The head of Moody’s Analytics, Mark Zandi, noted, “High-income households are fine, but the bottom third of US consumers are tapped out,” adding, “Their savings rate right now is zero.”
Two thirds of the country own their home and one third rents. The renter households are more likely to be those impacted by credit card defaults, making it more difficult to handle rent increases and qualify for a new apartment.
_________________________________________
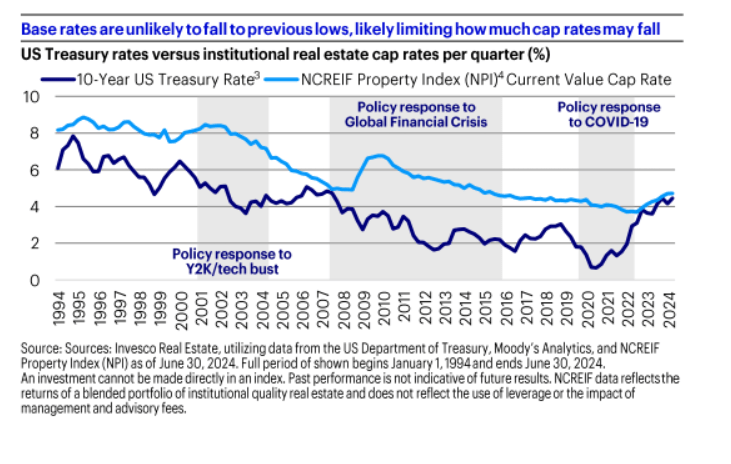
Cap rates typically average about 100-200 basis points above the 10-year treasury yield. To get back to average levels from where we are today, either cap rates need to rise, or the 10-year treasury needs to fall. Significantly.
_____________________________
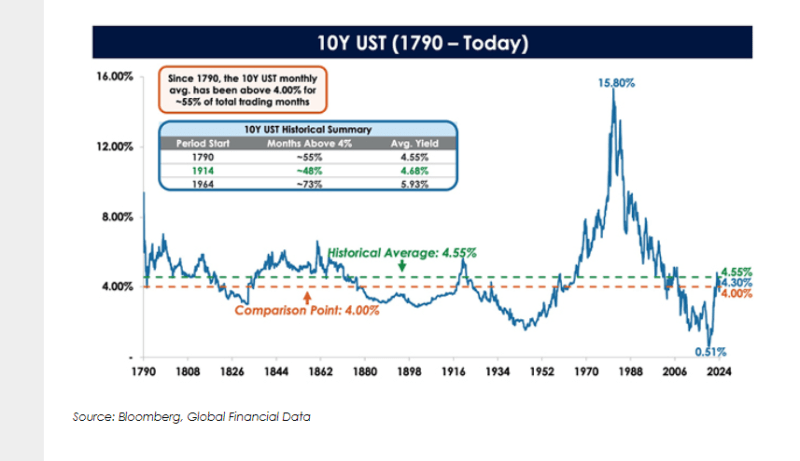
If you zoom out and look at a chart of the 10-year treasury going back hundreds of years, it has averaged 4.55%. If you begin measuring from 1914, it has averaged 4.68% and if you begin measuring from 1964, it has averaged 5.93%.
The low rates we experienced from 2012 – 2022 were an anomaly that has never happened in history, other than a brief period around World War 2 when the Fed had to execute yield curve control (QE) to force rates down and keep them low to finance the war.
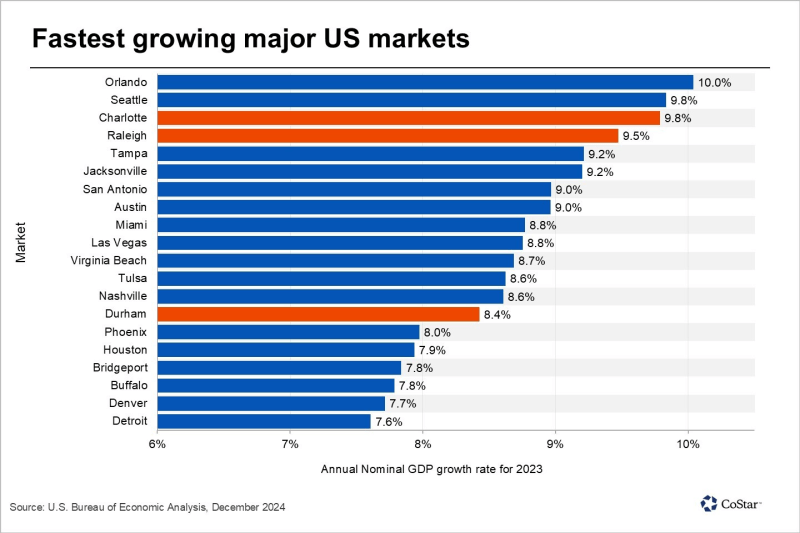
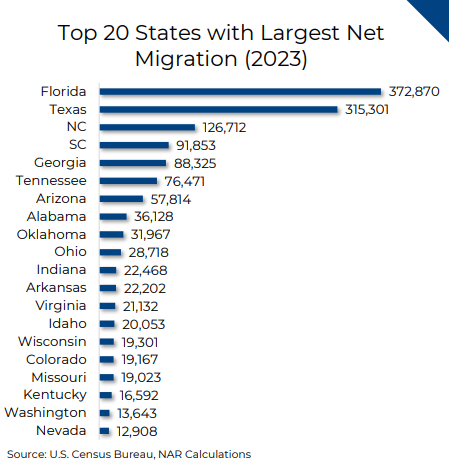
In addition to being the fifth-fastest population growth state in the country, North Carolina is home to cities that enjoy some of the strongest economic growth in the nation.
Monthly starts came in at 264,000 units, down 24.1% (84,000 units) from the revised (+22,000 units) figure from the previous month.
The previous month’s starts were revised lower by 2,000 units to 295,000
Compared to the year-earlier level, multifamily housing starts in buildings with 5 or more units were down 28.8 percent. The reported starts figure was 23.9 percent lower than the trailing 12-month average.
What It Means: It typically takes about 2 years to complete a new multifamily project, so as new starts continue to decline it will create dramatically less available housing supply in 2026-2027. Less supply helps current owners raise rents.
Monthly completions came in at 544,000 units on a seasonally adjusted, annualized basis, down 11.1% (68,000 units) month-over-month. The previous month was also revised down 3,000 units.
Compared to the trailing 12-month average, completions were down 5.3 percent.
The total number of units under construction (780,000 on a seasonally adjusted basis) continued its downward trend. This is down 45,000 units from the previous month and 20.9% lower than the number of units under construction a year earlier.
What It Means: While the number of completions (new supply) continues to be high, we are approaching the moment of “peak new supply” which will crest, descend rapidly, and stay low through 2026. We can see this based on the starts data discussed above.
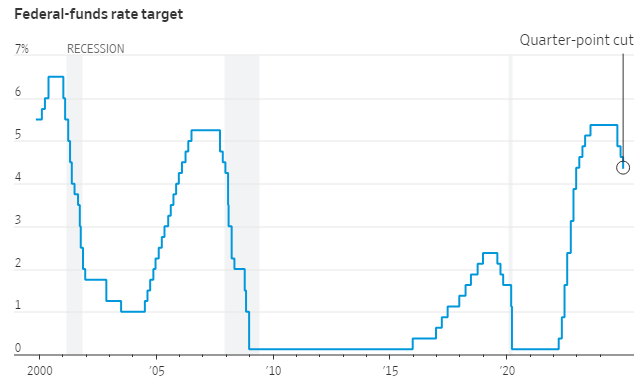
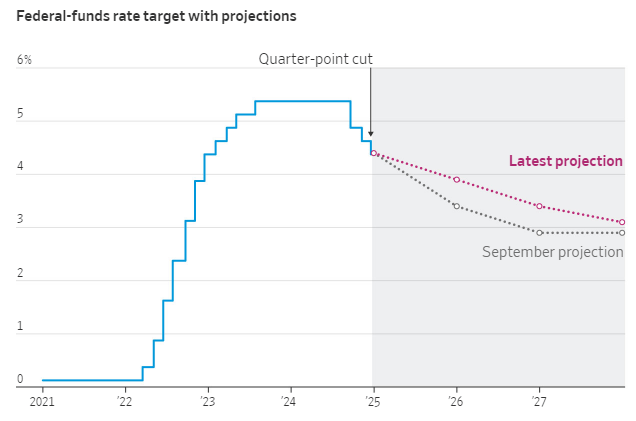
The Fed cut interest rates 25 basis points, as expected
While the statement and press conference were more hawkish than expected, things can change dramatically as we get more economic data in the weeks and months ahead. Last year at this time the Fed was projecting 0.75% in rate cuts. They ended up cutting 1.00%.
When asked if the Fed would consider hiking rates, Powell said, “That doesn’t appear to be a likely outcome.”
Powell noted that core PCE falling to 2.5% next year would be considered meaningful progress (meaning even though it’s still above their 2.0% target, they would still consider themselves on track)
If the Fed raised the core PCE forecast to 2.5% with 2 cuts, they have actually lowered the bar for more than 2 cuts
Powell stressed that labor is not creating inflationary impulses
Powell: “We think the labor market is cooling in a significant way.” He stressed the want to avoid further deterioration in the labor market.
After two years of rapid increases, multifamily expense growth is beginning to moderate. Through October, expenses in U.S. market-rate properties rose an average 4.0% year-to-date, down from 9.0% in 2023 and 7.1% in 2022.
Property insurance increases have leveled off in 2024, as the higher premiums have helped insurers get back on solid footing.
Growth in other expense categories such as labor and maintenance have also moderated and should remain muted unless driven up again by an exogenous event.
Net operating income growth continues to be positive as revenue streams remain positive. Income growth of 2.6% year-to-date has produced a 1.9% increase in NOI. Affordable properties have recorded 6.0% revenue growth year-to-date through October, producing a 7.1% increase in NOI over that time.
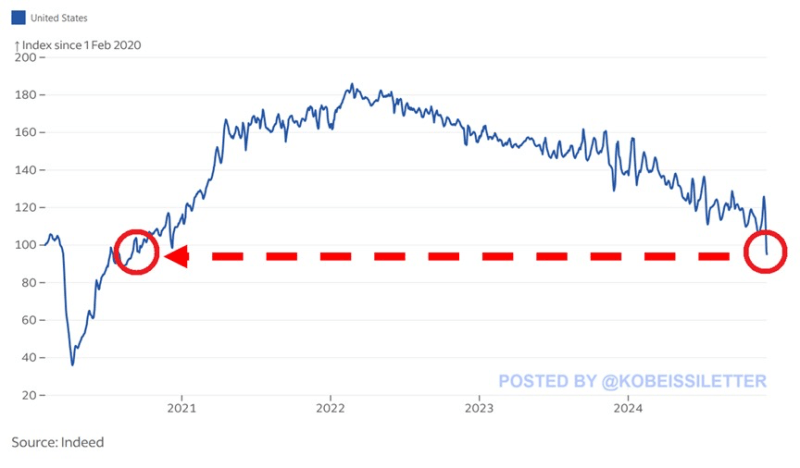
New job postings on Indeed fell 38% year-over-year last week and now stand at the lowest level since August 2020.
Job postings have dropped for nearly 3 years straight and are now down 49% since the February 2022 peak.
As a result, new available vacancies are 5% below pre-pandemic levels.
Data provided by Indeed is more current than the government data
What It Means: If the jobs market is weakening more than expected under the surface, it will make the Fed more likely to cut aggressively in the months ahead as this data begins to show up in the government’s employment data
The Fed cut rates 25 basis points, as expected, but the good news ended there
They reduced the number of cuts they expect next year from 4 (-1.00%) down to 2 (-0.50%)
Powell: “We expect to slow the pace of cuts”
Historically the 10-year treasury average is about 1.50% above the Fed Funds rate (to compensate for the risk in holding bonds longer in duration). That means the 10-year treasury should be at 5.75% today and should end up at about 5.00% at the end of 2028 based on their current projections:
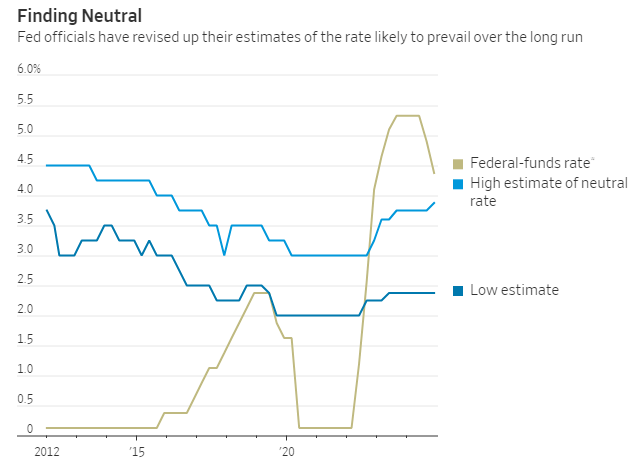
The Fed continues to raise estimates of where the neutral Fed Funds rate needs to be (where it does not stimulate the economy or cause it to slow it down). If it lands at the higher end of estimates, they are almost done cutting.
They raised the longer run Fed Funds rate to 3.0%, up from 2.50% a year ago
The odds of the next rate cut currently do not exceed 50% until the June 2025 meeting
They raised their 2025 PCE inflation forecast from 2.1% to 2.5%
Powell when asked why he didn’t use the word “recalibration,” said, “We’re not renaming the phase yet, but we may get around to that. We are in a new phase of the process. We are significantly closer to neutral and it’s appropriate to proceed cautiously.”
Powell mentioned that some FOMC members attempted to project Trump’s (inflationary) policies into their models.
What It Is: Before starting construction, builders need permission from local authorities. A permit ensures the project follows safety codes and regulations. It’s considered the first step in the process to building new units, so it’s an early indicator of future supply
Permits were up 22.1% from the previous month at 481,000 on a seasonally adjusted annual basis. They were up 4.8% from their year-earlier level and up 11.1% from the trailing 12-month average.
What It Means: While permits do not mean a developer will definitely move forward with construction, it’s a worrying sign for current property owners hoping for less new supply to compete against in the coming years
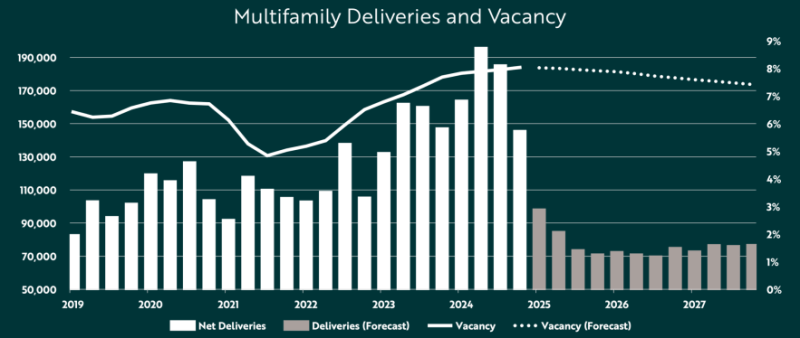
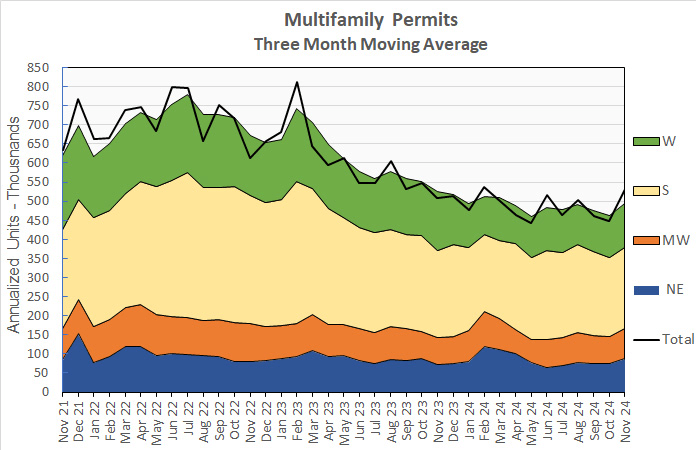
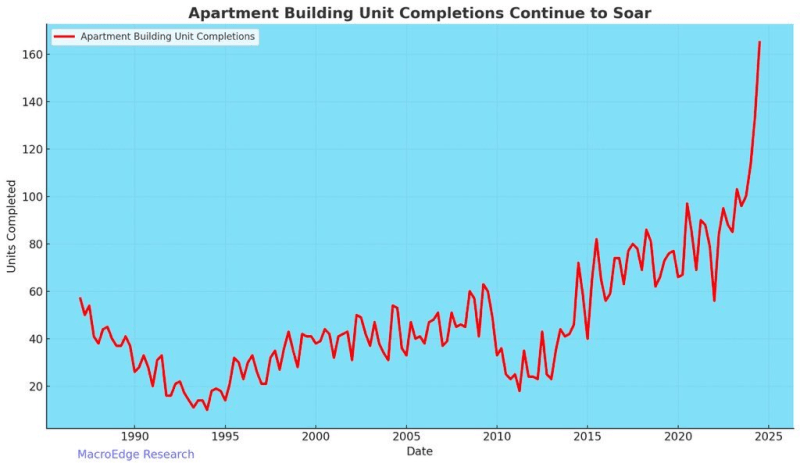
Multifamily Completions/Supply Continues To Surge:
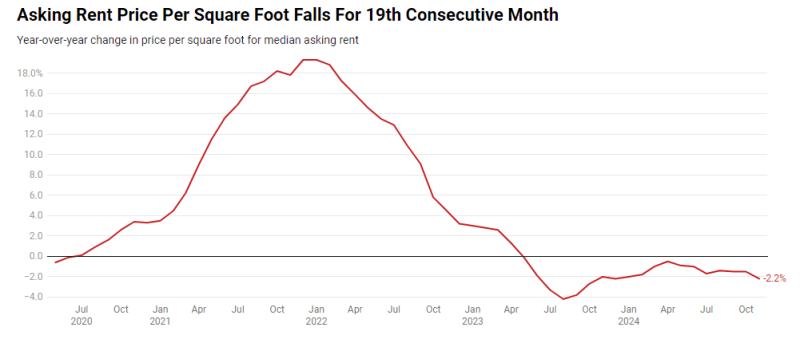
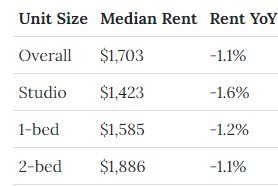
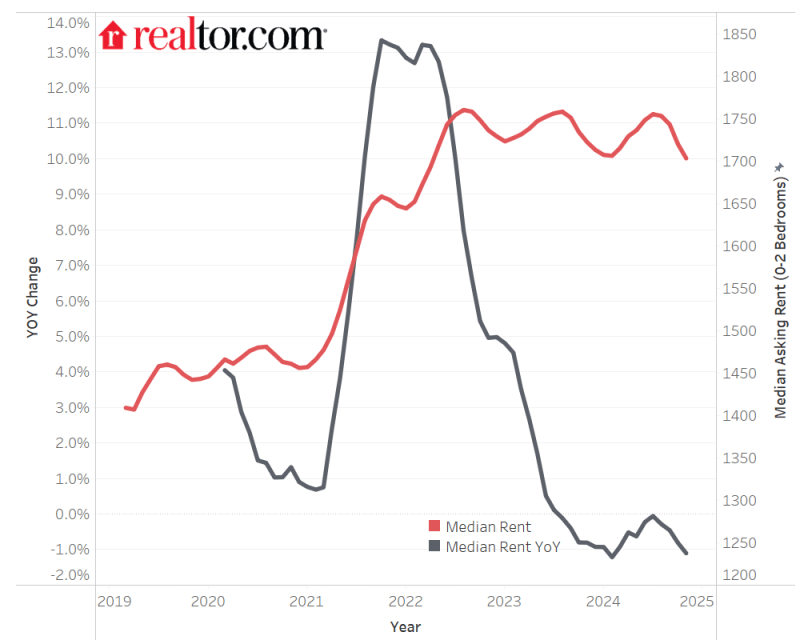
The median U.S. asking rent fell 0.7% year over year in November to $1,595, the lowest level since March 2022.
Rents were down 1.1% on a month-over-month basis.
The asking price per square foot for rental apartments fell 2.2% year over year to the lowest level since December 2021
Rents dropped across all bedroom counts for the fifth consecutive month.
The median rent is now 6.2% lower than when it hit an all-time high of $1,700 in August 2022
Nationally, apartment completions rose 22.6% year over year to the highest level in over 12 years in the second quarter. As a result, the vacancy rate for buildings with five or more units rose to 8% in the third quarter, the highest level since early 2021.
What It Is: Show how many people filed for unemployment benefits during the past week
Claims jumped from 225,000 last week to 242,000 this week, much higher than expected
What It Means: A weaker jobs market could make the Fed more aggressive cutting rates in the months ahead
This Week’s Pensford Letter (12/9/24): If This Month’s Employment Report Focused On The Unemployment Rate, Instead Of The Headline Payrolls Number, Here Is How It Would Read:
The labor market deterioration accelerated in November as the economy shed another 355k jobs.
The unemployment rate ticked up to 4.2% but benefitted from rounding down. The true print was 4.246%, which gets reported as 4.2%. Had just 6,700 more people reported being unemployed, the headline UR would have been 4.3%. It was 3.3% a year ago.
Over 7.1 million Americans are now unemployed, an increase of nearly one million from last year. The number of workers settling for part-time jobs due to weak economic conditions has ballooned to 4.5 million, up from 4.0 million last year.
Long-term unemployment, a key indicator of structural labor market problems, is up 41% over the past year. 1.7 million workers have now been jobless for over 6 months, up from 1.2 million a year ago.
The employment-population ratio continues its worrying decline, dropping to just 59.8%. More Americans are simply giving up looking for work, with labor force participation falling to 62.5% – extending a concerning downward trend that began last December.
The unemployment to employment ratio, which measures the % of unemployed that became employed last month. Excluding covid, it’s at its lowest level in 10 years.
The overall hiring rate fell to 3.3%, lowest since June and comparable to 2013 levels.
Job openings are still down 36.4% from March 2022 peak.
Full-time jobs fell 111k, part-time down 268k.
Multiple job holders increased by 275k.
Permanent layoffs are trending higher, now above 1% of labor force.
Average monthly job revisions of -36k since December 2022, a level rarely seen outside recessions.
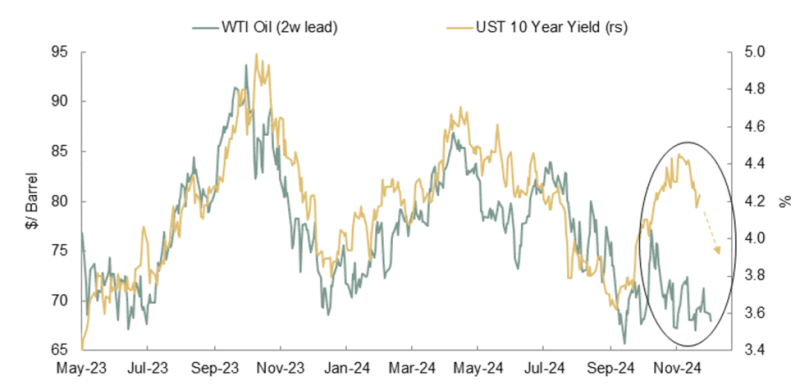
This is why the market’s odds of a Fed rate cut rose to 86% after the jobs report. But what about the 10 Year Treasury? Given the high correlation between oil and rates, it looks ready to fall below 4% in the weeks ahead:
_______________________________________
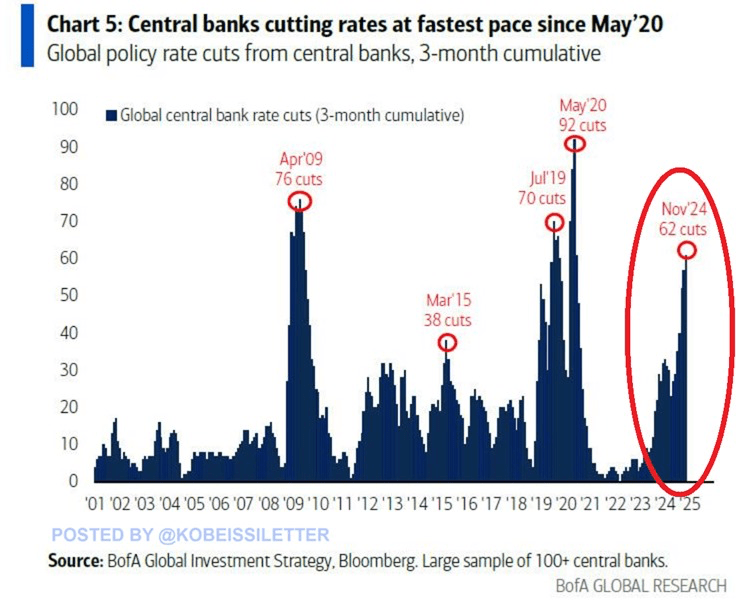
Global central banks have conducted 62 rate cuts over the last 3 months, the most since the 2020 pandemic. This is the 4th fastest pace of rate cuts this century. To put this into perspective, during the peak of the Financial Crisis in 2009, global central banks implemented 76 rate reductions.
What it means: If rates are falling around the world it makes United States yields, included multifamily cap rates, more attractive to global investors.
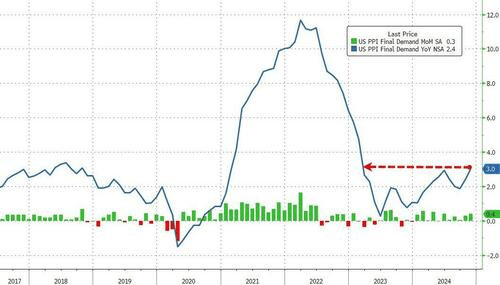
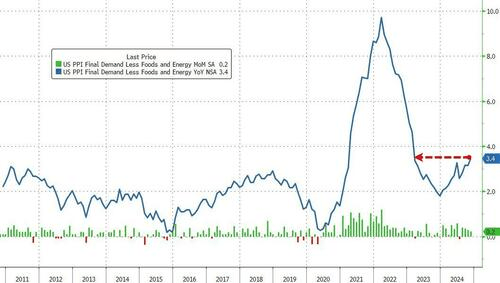
What It Is: Measures the change in prices for goods and services before they reach consumers
Up 0.4% month-over-month, on expectations of 0.2%, the highest increase since June
The year-over-year rate came in at 3.0%, far above expectations, and the highest since February 2023
Core PPI (excludes food and energy) jumped to 3.4% year-over-year, much higher than expected and the highest since February 2023
What It Means: A much hotter than expected inflation number pushes the Fed further away from their 2.0% inflation target and may reduce the number of times they cut rates over the coming year
What It Is: Measures the average change in prices that consumers pay for goods and services over the past month.
Inflation rose 0.3% month-over-month bringing the annual rate up to 2.7%, the highest reading since July and trending in the wrong direction
Core CPI (excludes food and energy) also rose 0.3%, higher than the expected 0.2%, bringing the annual rate up to 3.3%
What It Means: Inflation remains sticky and has been moving further away from the Fed’s 2.0% target for months. This may reduce the number of times the Fed cuts interest rates over the coming year.
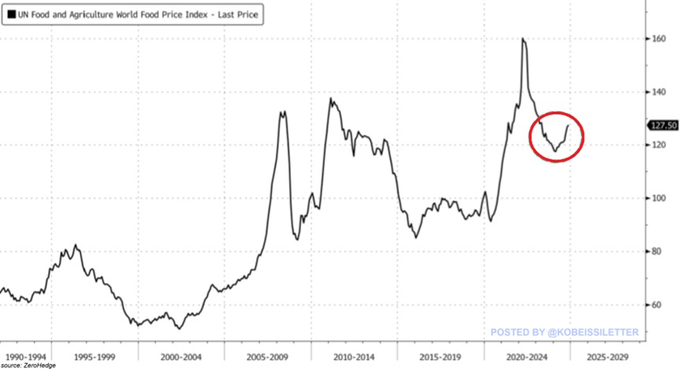
One of the more worrisome categories in the inflation reports has been food prices, which are back on the rise. The UN Food and Agriculture World Food Price Index has been now rising for 5 straight months. Since the beginning of 2020, global food prices are up 26.5%.
What it is: A monthly report that gives an estimate of how many new jobs were created in the U.S. private sector. It’s published by a company called ADP, which processes payrolls for many businesses.
146,000 new private jobs were created in the private sector last month, below the expectations of 166,000.
The previous month was also revised down to 188,000.
What it means: A weaker than expected report makes the Fed more likely to cut interest rates
Despite adding 5.8 million housing units over approximately four years (since our previous estimate), housing demand has increased by almost the same amount, resulting in very little progress in reducing the housing shortage.
In the aggregate, we estimate that U.S. housing stock is 3.7 million units below what is needed given our current population and assuming inflation-adjusted housing costs returned to historical levels.