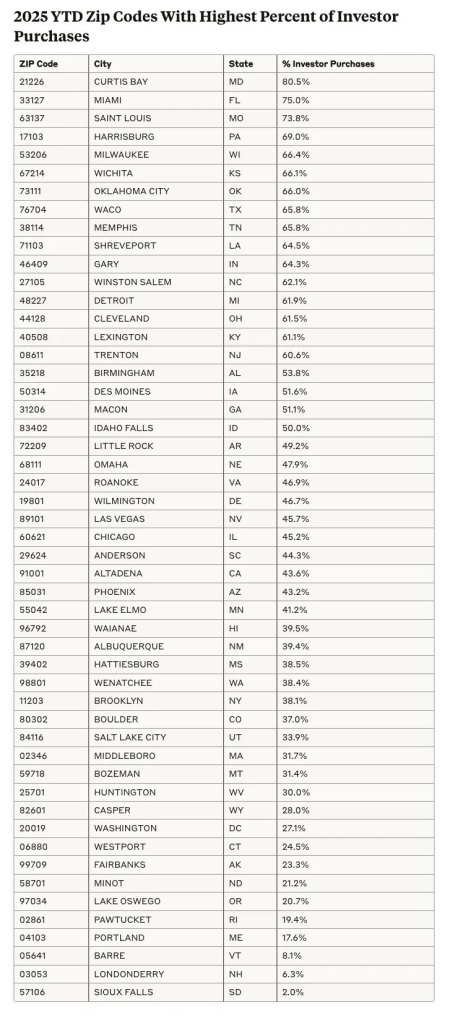
Winston-Salem is the only city in North Carolina with a zip code that made the list.
Source: Gavin Campbell
Winston-Salem is the only city in North Carolina with a zip code that made the list.
Source: Gavin Campbell
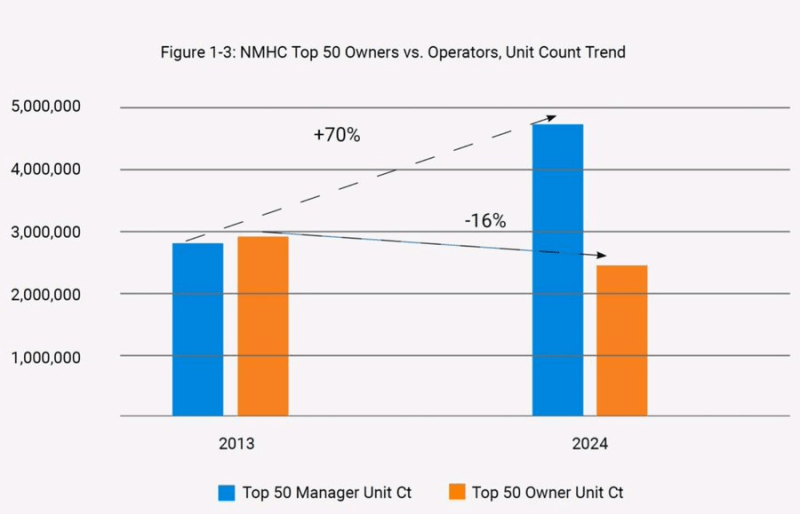
Source: Jay Parsons

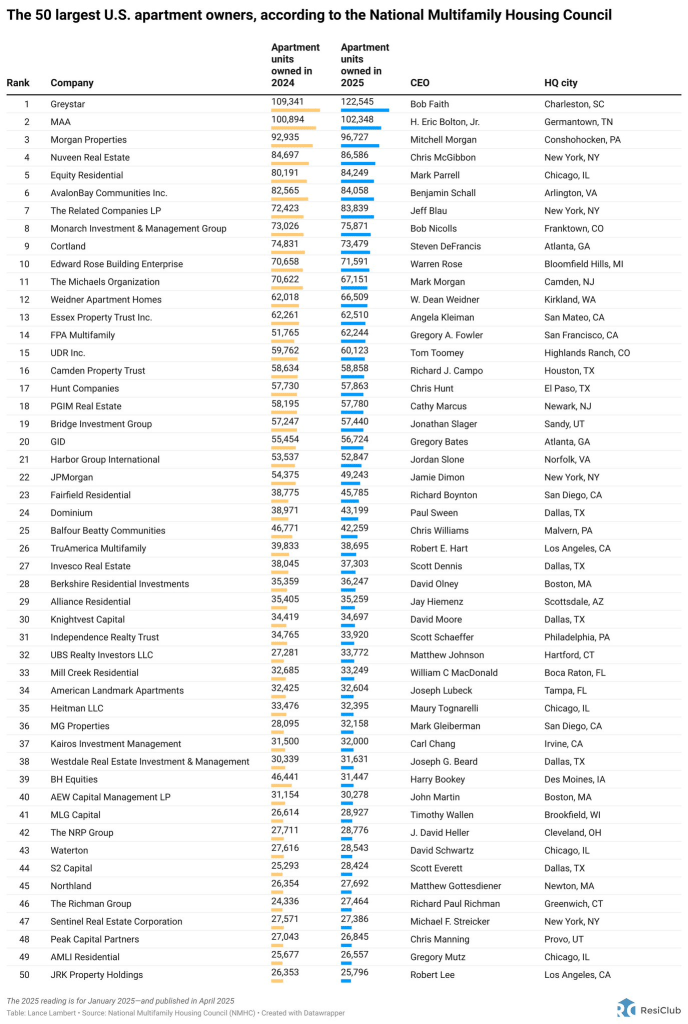
It’s interesting to note that while the largest apartment owners actually have fewer units than they did 11 years ago, the largest third-party property managers have growth the number of units they manage significantly.
Source: Jay Parsons
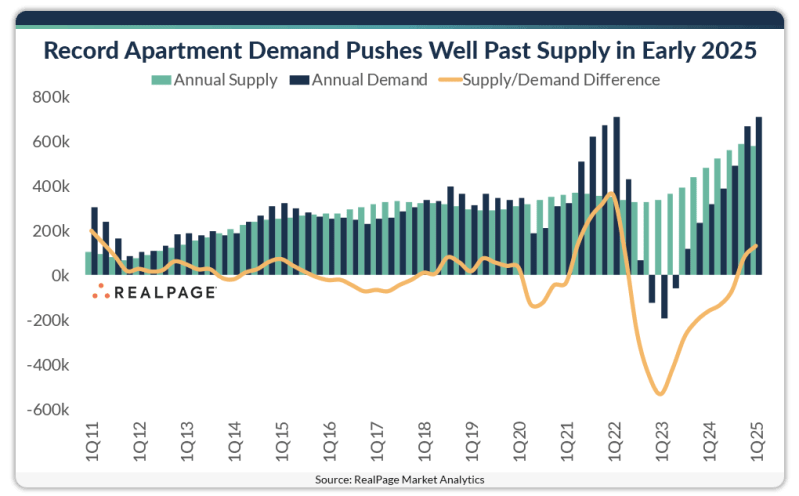
Source: RealPage
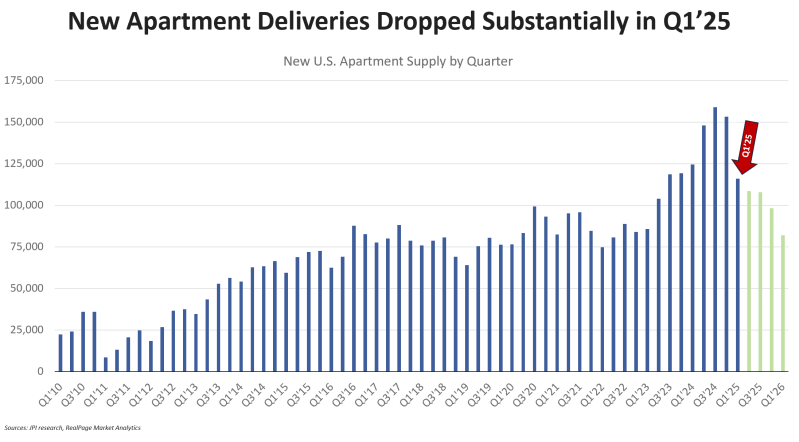
A little over 576,700 units were delivered in the year-ending 1st quarter 2025. That was slightly below the all-time peak of 585,200 units from calendar 2024. From this point on, delivery volumes are scheduled to drop off for the next few years as developers wrap up the current pipeline of projects.

Annual supply is scheduled to drop to about 431,200 units by the end of 2025. After that, deliveries are expected to fall off even further, returning to more historic norms by 2026 if current construction timetables hold.

Source: RealPage
Americans need to earn $116,633 per year to afford the median priced home for sale. That’s 81.8% more than the $64,160 they need to afford the typical apartment for rent—and the gap has been widening.
The cost of buying a home is rising faster than the cost of renting, which is why there’s a growing gap between the income someone needs to afford their own home versus an apartment. The median home-sale price rose 4.5% year over year to $423,892 in February, and has been growing at roughly that pace for months.
The typical U.S. household earns an estimated $86,382—roughly $30,000 less than the income required to afford the typical home for sale. Meanwhile, the median asking rent rose just 0.2% year over year.

Source: Redfin
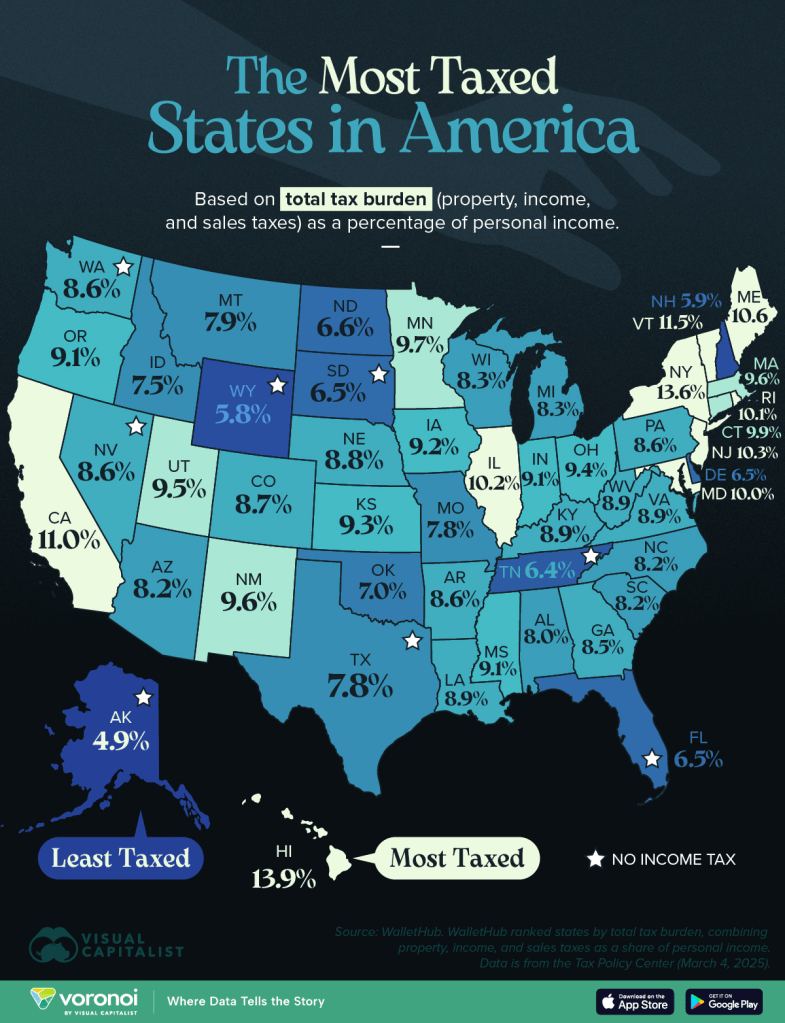
| 1 | Hawaii | 13.9% |
| 2 | New York | 13.6% |
| 3 | Vermont | 11.5% |
| 4 | California | 11.0% |
| 5 | Maine | 10.6% |
| 6 | New Jersey | 10.3% |
| 7 | Illinois | 10.2% |
| 8 | Rhode Island | 10.1% |
| 9 | Maryland | 10.0% |
| 10 | Connecticut | 9.9% |
| 11 | Minnesota | 9.7% |
| 12 | New Mexico | 9.6% |
| 13 | Massachusetts | 9.6% |
| 14 | Utah | 9.5% |
| 15 | Ohio | 9.4% |
| 16 | Kansas | 9.3% |
| 17 | Iowa | 9.2% |
| 18 | Indiana | 9.1% |
| 19 | Mississippi | 9.1% |
| 20 | Oregon | 9.1% |
| 21 | Louisiana | 8.9% |
| 22 | Kentucky | 8.9% |
| 23 | Virginia | 8.9% |
| 24 | West Virginia | 8.9% |
| 25 | Nebraska | 8.8% |
| 26 | Colorado | 8.7% |
| 27 | Nevada | 8.6% |
| 28 | Washington | 8.6% |
| 29 | Arkansas | 8.6% |
| 30 | Pennsylvania | 8.6% |
| 31 | Georgia | 8.5% |
| 32 | Wisconsin | 8.3% |
| 33 | Michigan | 8.3% |
| 34 | Arizona | 8.2% |
| 35 | North Carolina | 8.2% |
| 36 | South Carolina | 8.2% |
| 37 | Alabama | 8.0% |
| 38 | Montana | 7.9% |
| 39 | Missouri | 7.8% |
| 40 | Texas | 7.8% |
| 41 | Idaho | 7.5% |
| 42 | Oklahoma | 7.0% |
| 43 | North Dakota | 6.6% |
| 44 | Delaware | 6.5% |
| 45 | Florida | 6.5% |
| 46 | South Dakota | 6.5% |
| 47 | Tennessee | 6.4% |
| 48 | New Hampshire | 5.9% |
| 49 | Wyoming | 5.8% |
| 50 | Alaska | 4.9% |
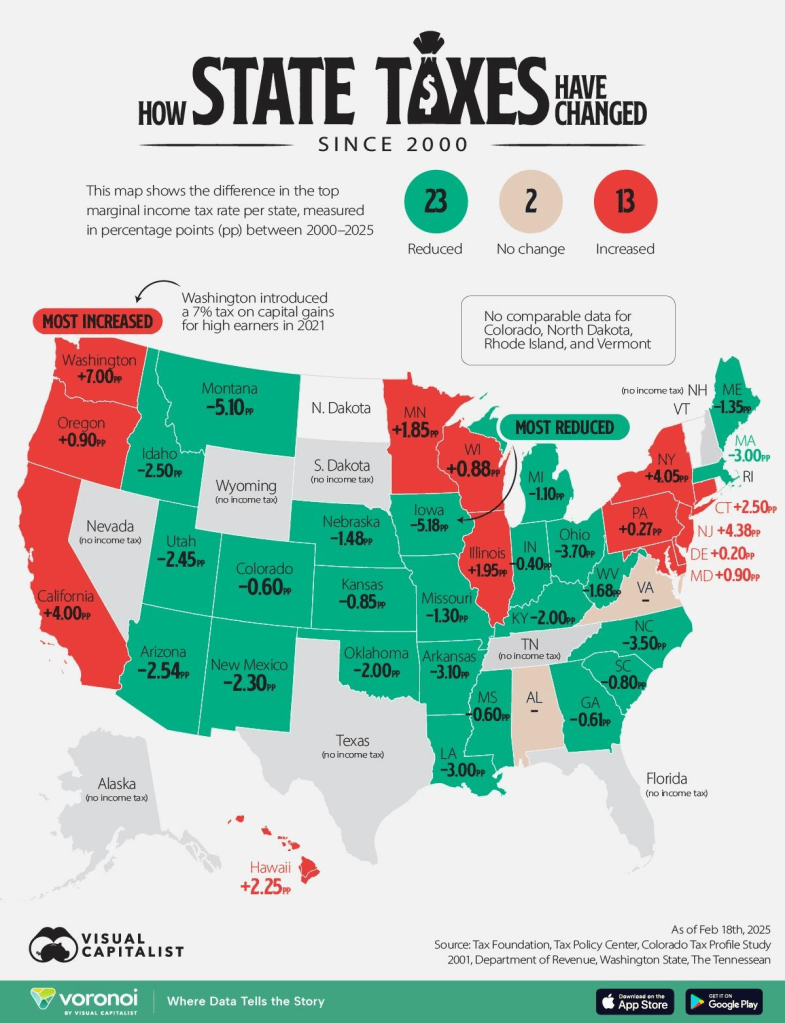
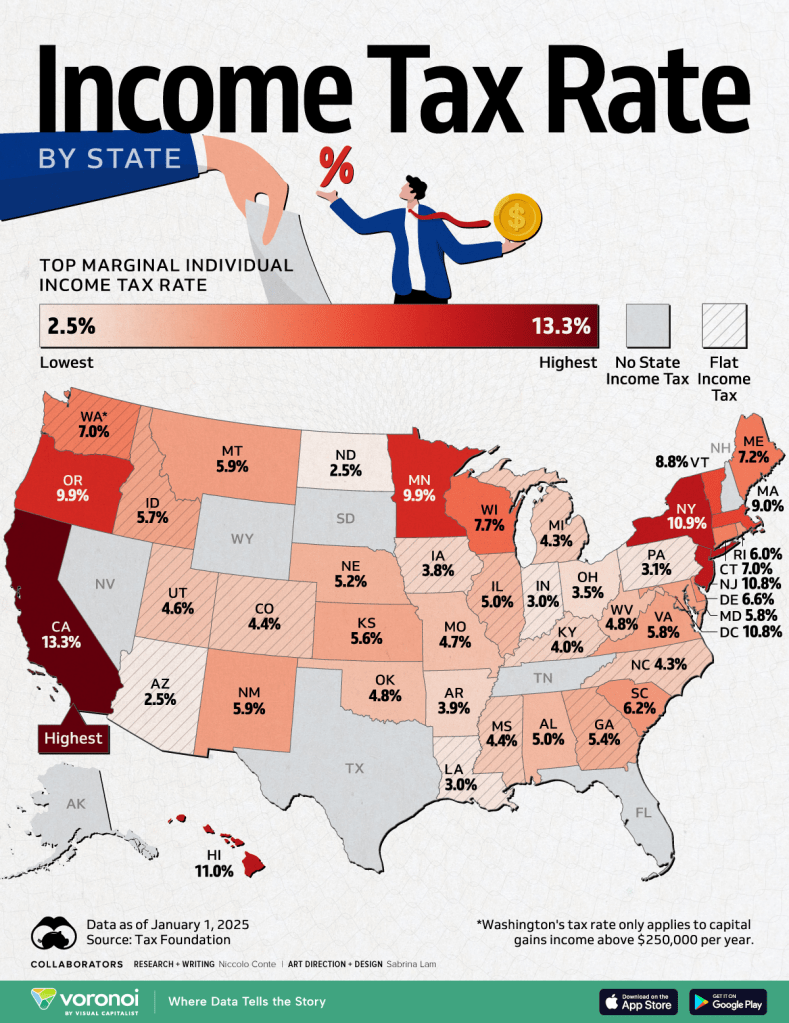
The graphic below shows how state income taxes have changed between 2000 and 2025. The gray states have no taxes. Changes are not compared for four states (Rhode Island, Vermont, North Dakota, and Colorado) since their 2000s tax rates were charged as a percentage of federal liabilities owed. As a result, they have been grayed out on the map
And the highest marginal income tax by state, shown below:
The Federal Reserve’s Interest Rate Decision, Statement & Press Conference – 3/19/25
The most significant part of the Fed’s statement is the reduction in the “redemption cap” on Treasury securities from $25 billion to $5 billion. This refers to the pace at which the Fed allows its balance sheet to shrink.
When Treasury securities on the Fed’s balance sheet mature, the Fed has a choice between doing nothing (a form of monetary tightening) or rolling over the position by buying new securities (a form of monetary ease or QE). By lowering the cap, there will be more rollovers and less balance sheet reduction. That is a dovish move that indicates monetary easing – a backdoor form of QE or even a rate cut.
The Fed lowered its inflation expectations and reduced its 2025 U.S. growth forecast from 2.1% to 1.7%. They also kept the unemployment forecast unchanged. Taken in combination with the decision to reduce the run-off in the balance sheet, this is a slightly dovish turn of events. It certainly strengthens the case for a rate cut at the Fed’s next meeting on May 7.
The U.S. unemployment rate hit an interim low of 3.4% in January 2023. From there, it rose to 3.9% in February 2024 then 4.2% in July 2024. Today, the unemployment rate is 4.1%, down slightly from last July but up significantly from January 2023. the labor situation and prospects for growth are worse than the headlines indicate. The household survey, a Labor Department survey different than the employer survey used to calculate the official unemployment rate, showed significant job losses in February. The number of employed individuals per the household survey dropped by 588,000. The Labor Force Participation Rate (total employed divided by total workforce) also dropped from 62.6% to 62.4%.
Major U.S. companies are issuing warnings that earnings in the first quarter will not meet expectations. Walmart, Best Buy, Target, Kohl’s, American Airlines and Delta Airlines are among those who have revised earnings and revenue forecasts downward. These and other developments point in the direction of higher unemployment and slower growth (if not recession).
The Federal Reserve’s Interest Rate Decision, Statement & Press Conference – 3/19/25
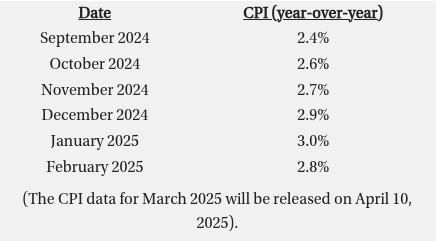
Inflation moving in the wrong direction: The trend reversed suddenly in October 2024 when inflation rose to 2.6%. It then rose further in November 2024 hitting 2.7% then rose again to 3.0% in January 2025, the highest rate since last July. The reading for February 2025 was 2.8%, (the latest data available).
From Powell: “A good part of [expected inflation] is coming from tariffs” and “inflation may be moving up due to tariffs.” Powell added that, “There are going to be tariffs and in the short-term they tend to bring inflation up.”
__________________________________
CRE & Multifamily Debt: Extend & Pretend Continues Into 2025
___________________________________
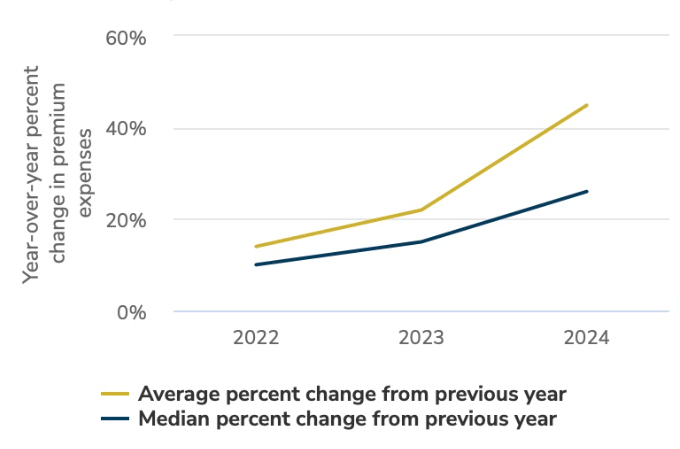
The Rising Cost Of Insurance Continues To Challenge Multifamily Operations
__________________________________________
A New Problem For Fractured Condo Investors: Insurance – 3/17/25