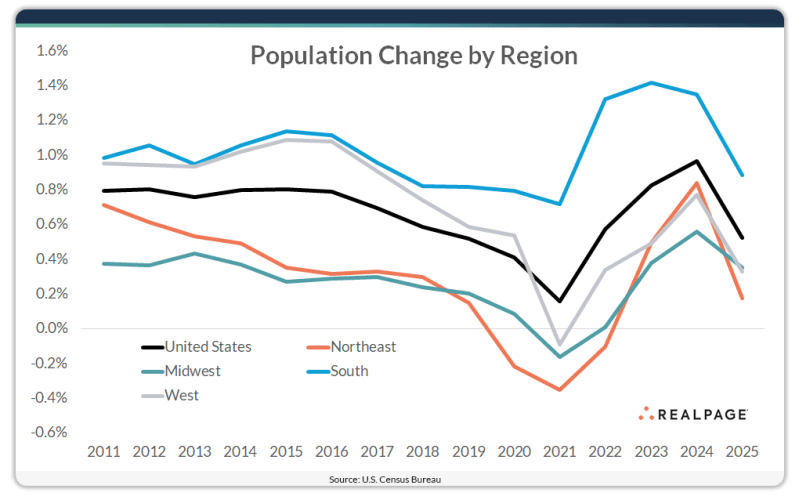
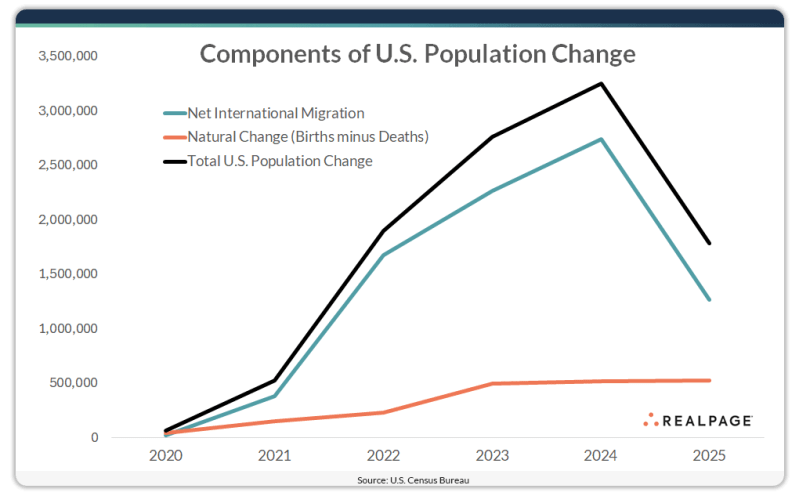
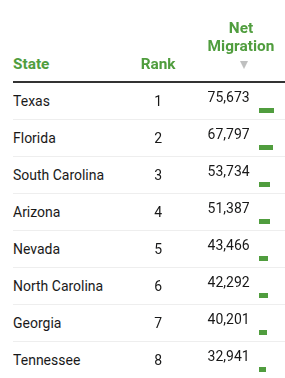
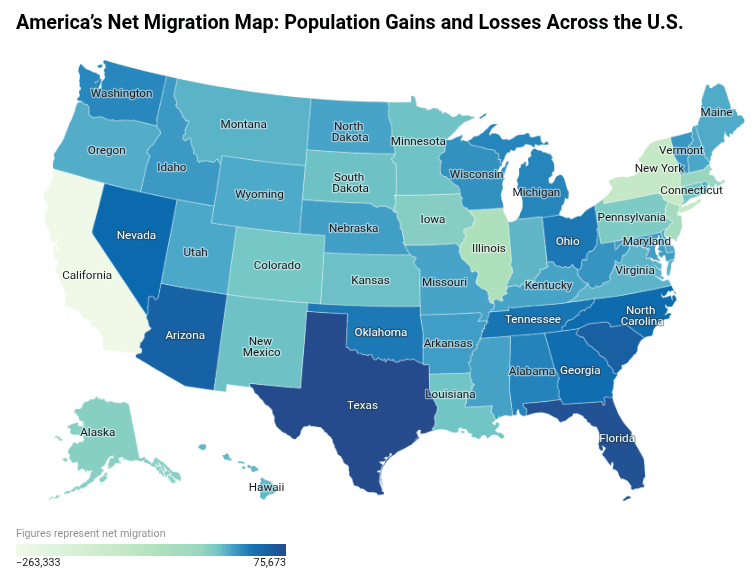
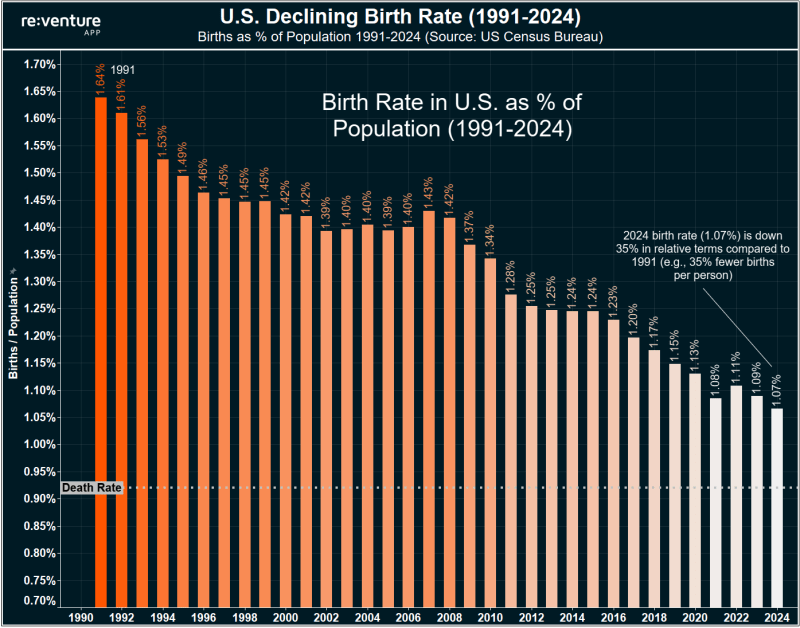
The population of the U.S. recently expanded at the slowest pace in four years. From July 1, 2024 to July 1, 2025, the U.S. gained roughly 1.8 million residents, according to U.S. Census Bureau estimates. All four U.S. census regions saw a decline in population growth.
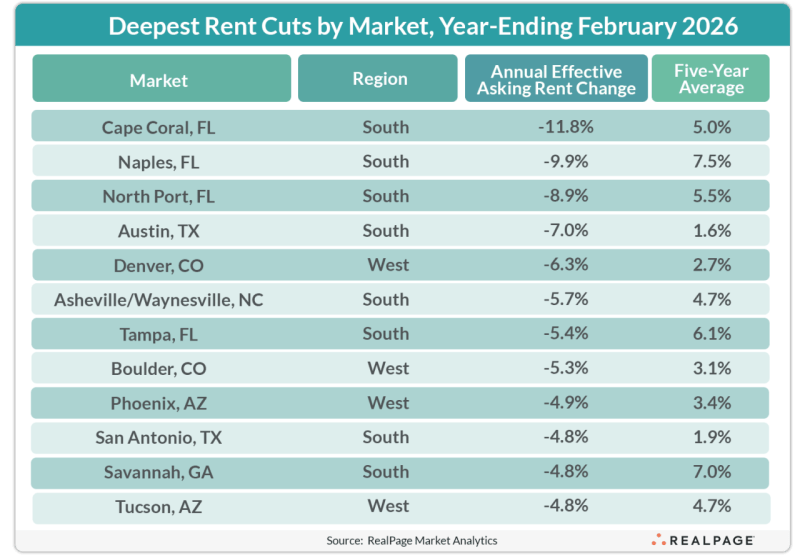
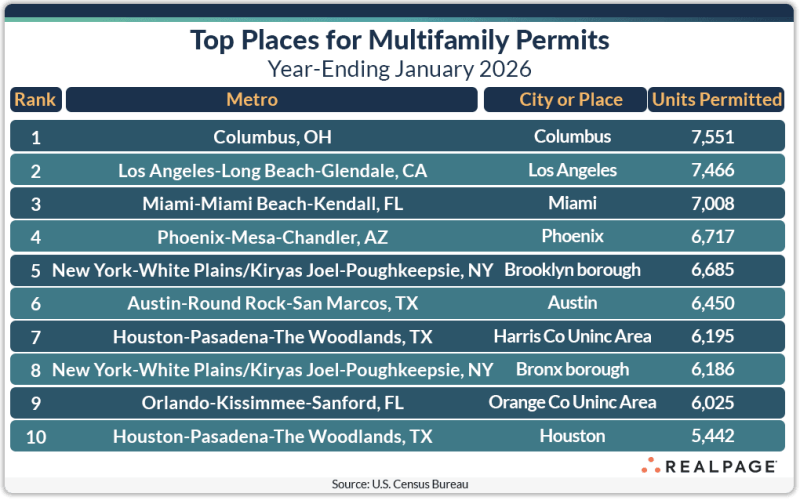
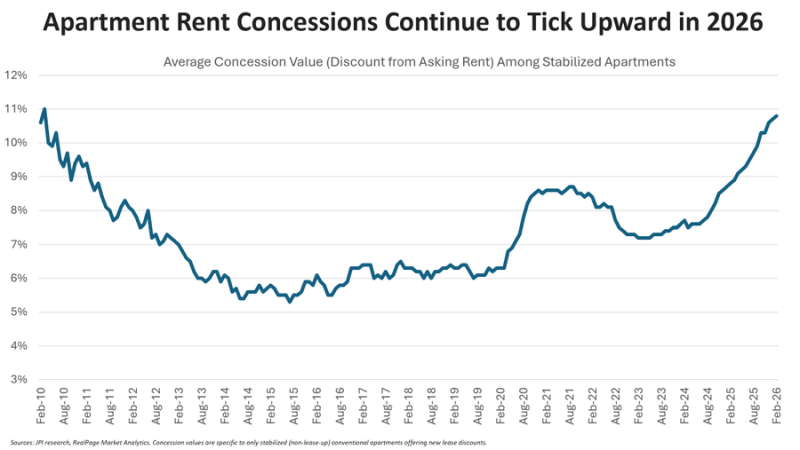
Operators across the U.S. cut rents in more than 40% of the largest 150 markets, including 27 of the top 50 markets, in the year-ending February 2026.
The national year-over-year average cut in the U.S. was 0.4%, which marked the seventh consecutive month of annual rent cuts across the nation.
The supply-heavy South (-2.0%) weighed down rents, followed by the West (-0.3%). Increases in the Northeast (2%) and Midwest (0.8%) minimized the total performance decline.
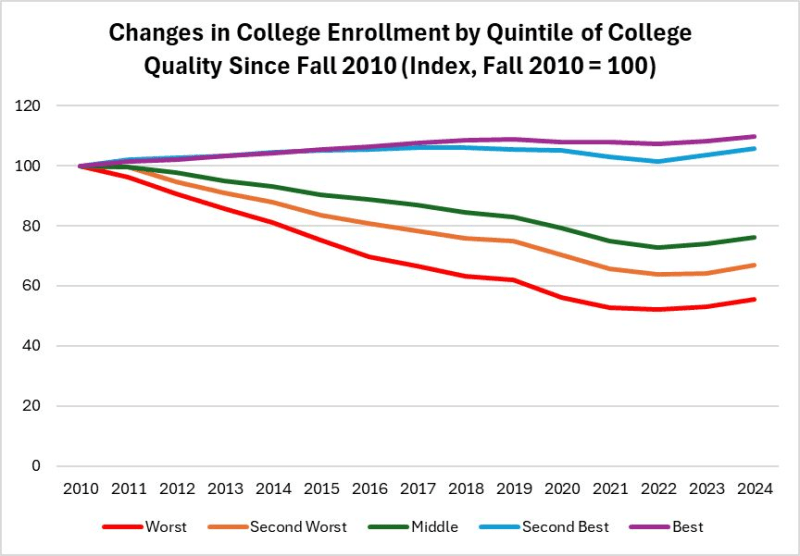
The top tier colleges have seen a small increase in the number of students enrolled. The lower tiers have experienced a substantial decline. Something to think about for student housing investors.
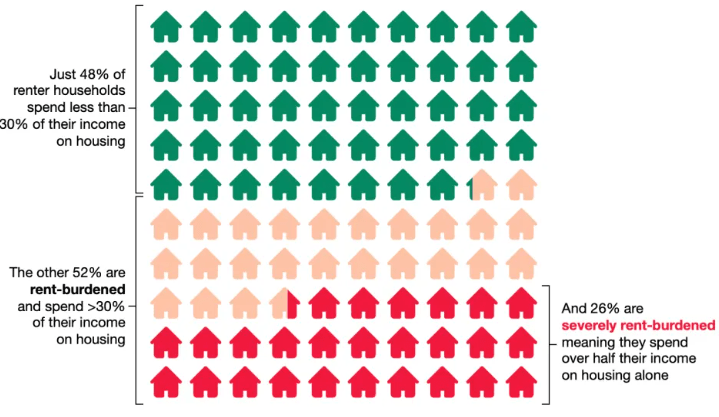
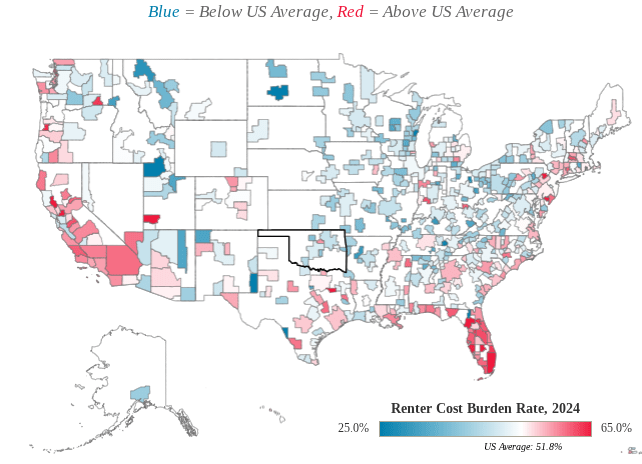
51.8% of all renter households are considered cost-burdened, spending more than 30% of their monthly income on rent.
More than one-in-four renter households spend over 50% of their income on rent, making them “severely cost-burdened.”
In some ways, the cost burden rate could even be underestimating the degree to which housing affordability has worsened. A lack of affordability has deterred new household formation in recent years, as Americans are increasingly doubling up with family or roommates to save on housing costs. These individuals are struggling with housing affordability, but because they don’t represent their own households, they are not captured in cost burden statistics.
Additionally, as the affordability of for-sale housing has eroded even more rapidly than that of rentals, more prospective homebuyers are continuing to rent. This subset of renters who have been sidelined from the for-sale market tend to be higher-income, and their presence in the denominator of the renter cost-burden rate could be depressing that rate slightly.
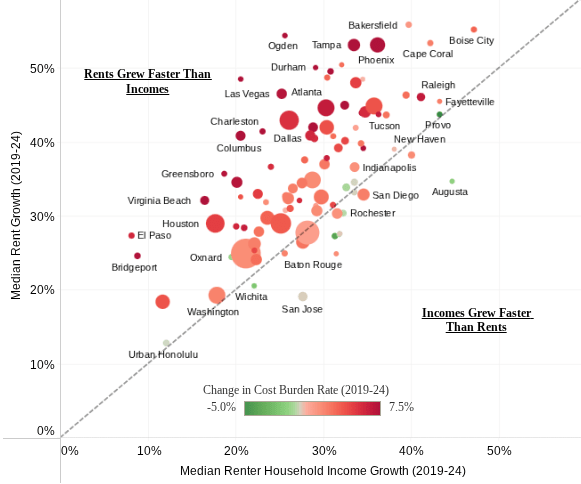
Rents are growing faster than income in 85 of the largest 100 metros: