The Mortgage Bankers Association (MBA) reported that multifamily mortgage debt outstanding rose by $24.97 billion in Q4. Total multifamily mortgage debt reached $2.086 trillion, up $105.5 billion (5.3 percent) year-over-year.

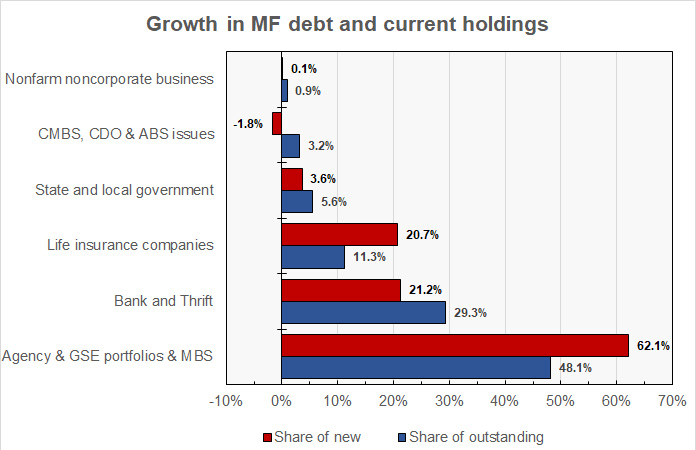
The Mortgage Bankers Association (MBA) reported that multifamily mortgage debt outstanding rose by $24.97 billion in Q4. Total multifamily mortgage debt reached $2.086 trillion, up $105.5 billion (5.3 percent) year-over-year.
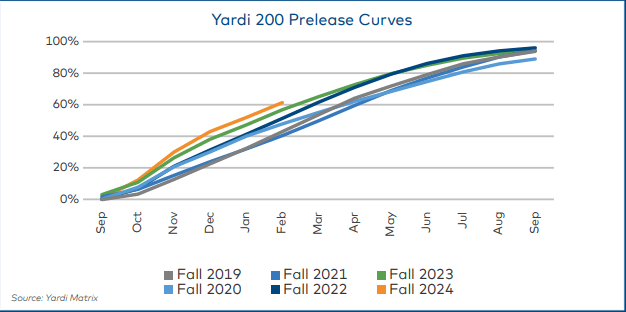
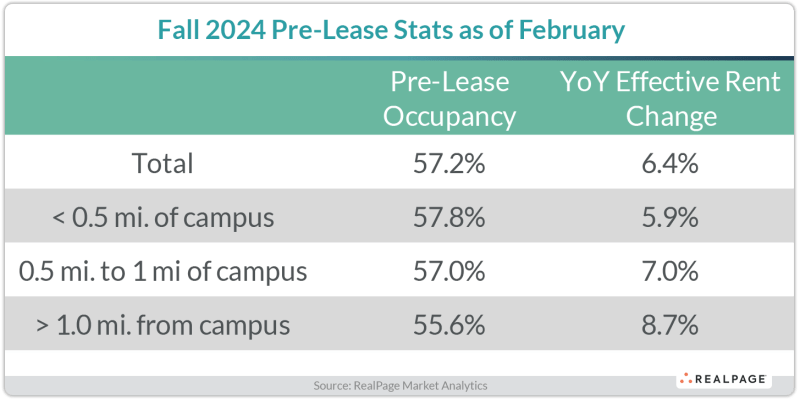
Through the end of February student housing beds were 61.5% preleased, well ahead of the 48% average over the five previous years. The average rent per bed is $883; up 5.2% year-over-year.
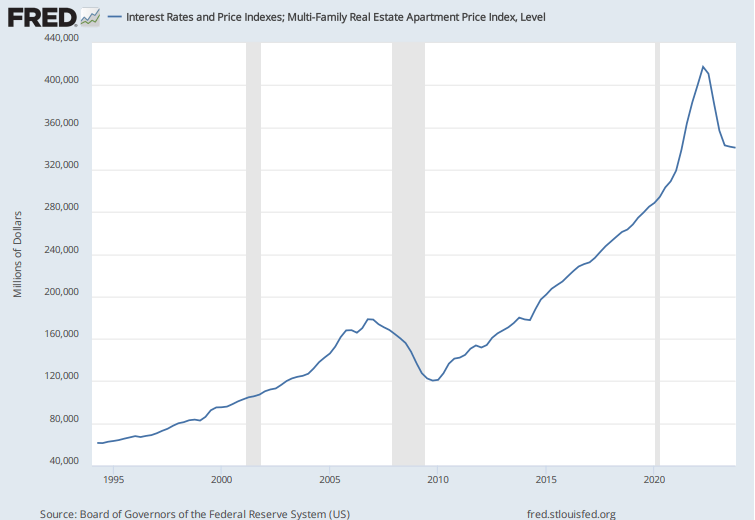
| Data Source: | Data Month: | Monthly Change: | Annual Change | From Peak |
| Green Street | Feb 2024 | 0.00% | -9.00% | -28.00% |
| MSCI | Feb 2024 | -1.00% | -8.90% | -18.40% |
| Average: | -0.50% | -8.95% | -23.20% |

Apartment demand in North Carolina and South Carolina ranks as the strongest in the nation, indexed by relativity. The Carolinas garnered apartment demand for 2.5 times more than the share of existing local stock in calendar 2023, topping every other region for the measure.
Apartment markets in the Carolinas absorbed nearly 25,000 units on net in calendar 2023. That accounted for about 10% of all U.S. absorption. But the Carolinas make up a relatively small piece of existing units across U.S. multifamily stock, with just a 4.2% share. Given the size of existing stock across the North and South Carolina, indexed absorption was especially high here in 2023.

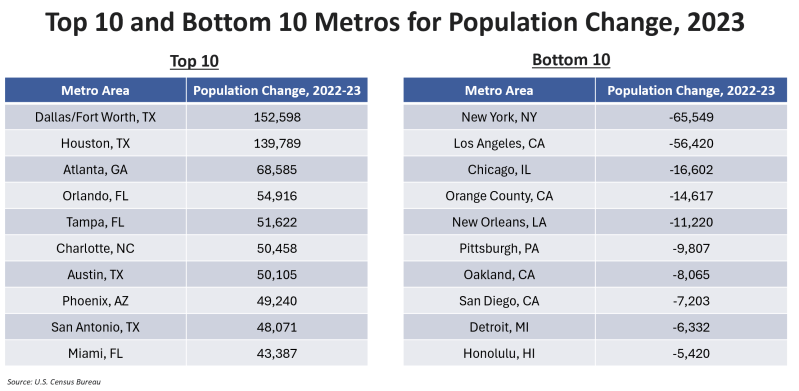
We hear a lot about supply in the multifamily world right now, but don’t forget about demand. The following are the Top 10 metros in terms of population growth over the last year:
The February pre-lease rate is just below last year’s all-time high of 58.2% through February 2023. The long-term average is around 50% through February.
Source: Real Page