151,000 jobs added. Private sector jobs increased 140,000 while government jobs increased by 11,000.
Average Hourly Earnings increased 0.3%, a year-over-year gain of +4.1%, the highest in three months. Importantly, this continues to be well above the 2.9% year-over-year inflation rate as of 3.0% last month.
What It Means: The jobs market continues to show strength with wages increasing above inflation. This makes the Fed less likely to cut interest rates in the months ahead.
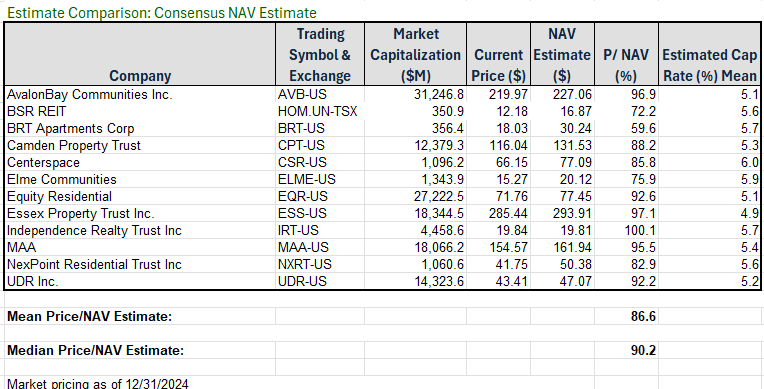
Multifamily REITs currently trade at discount of about 12% relative to their Net Asset Value. A discount to NAV means the stock prices is lower than the total value of the properties the company owns.
For example, if the total valuation of the company is $880 million, but the REIT (and the market) believes they can sell every property they own for $1 billion, then the stock trades at a 12% discount to its NAV.
The table below highlights specific multifamily REITs and their discount to NAV (the “P/NAV” column).
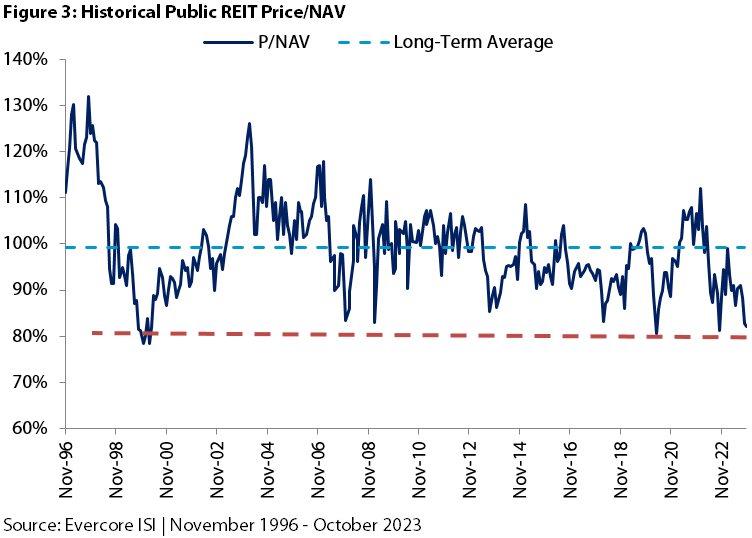
The graph below provides a historical view of all public REIT types going back to 1996, illustrating the fluctuations in price-to-NAV, where values above 100% represent a premium and values below 100% indicate a discount.
What It Is: Personal Consumption Expenditures: Measures how prices are changing in the economy.
The PCE price index (the Fed’s preferred inflation measure), increased by 0.3% month-over-month as expected, bringing the annual rate to 2.5%
Core PCE, which excludes food and energy, also rose 0.3% month-over-month, bringing the annual rate to 2.6%
PCE Supercore fell to just 0.22% month-over-month from 0.38% last month. Supercore focuses only on the least volatile items like rent, medical services and other goods that have more predictable prices changes.
What It Means: The report was good (but not great), and provides some room for the Fed to continue cutting if the employment market shows weakness in the coming months
____________________________________
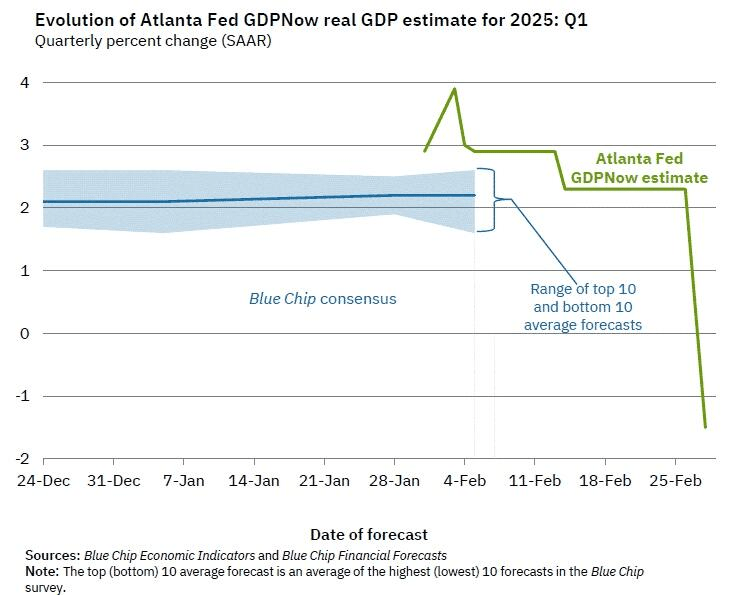
The Atlanta Fed’s GDPNOW model, forecasting US economic growth, just downgraded its estimate of Q1 2025 GDP growth from positive 2.3% to negative 1.5%. A slowing economy makes investors more likely to be defensive (buy treasuries) and makes the Fed more likely to cut interest rates.
_______________________________________
Bloomberg Economics estimates that if DOGE attempts to go for savings of $600B per year, GDP could fall by 2% by the end of this year, the unemployment rate could rise by nearly a percentage point, and CPI year-over-year could fall by nearly 0.9 percentage points.
The Fed has a dual mandate, low inflation and low unemployment, so this scenario would dramatically speed up their rate cutting cycle over the next 18 months.
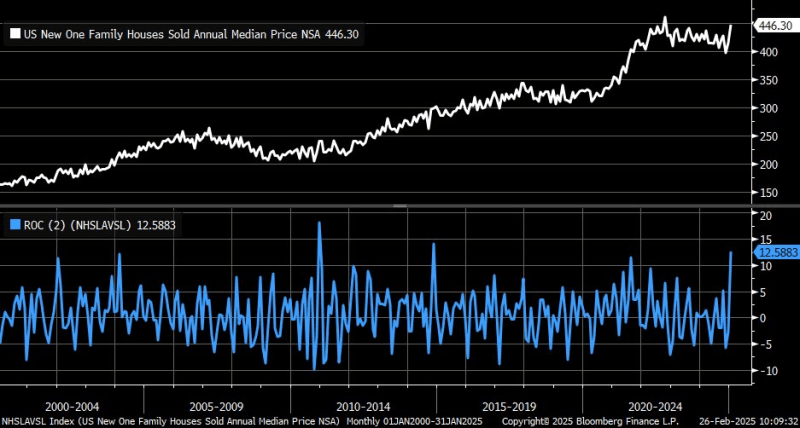
The median new single-family home prices spiked to $446,300 this month. The 2-month change is now up to +12.6%, which is the largest increase since November 2014. Rising home prices push affordability even further way for current renters.
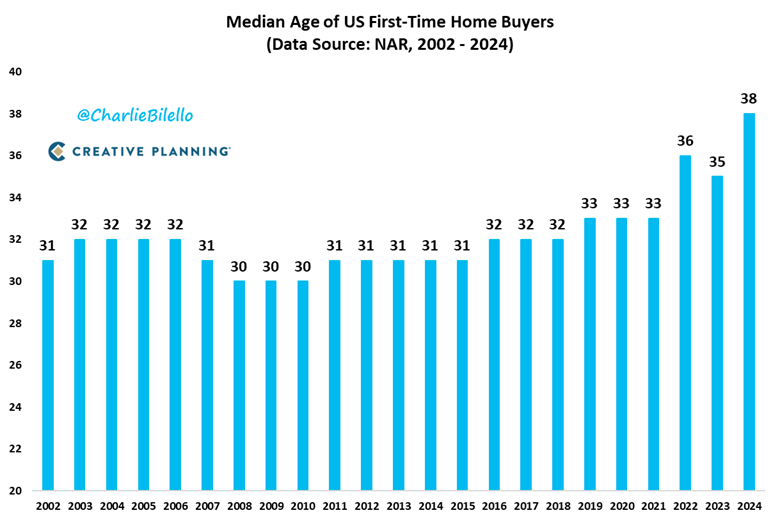
The median age of first-time home buyers continues to rise, creating more demand for rental units:
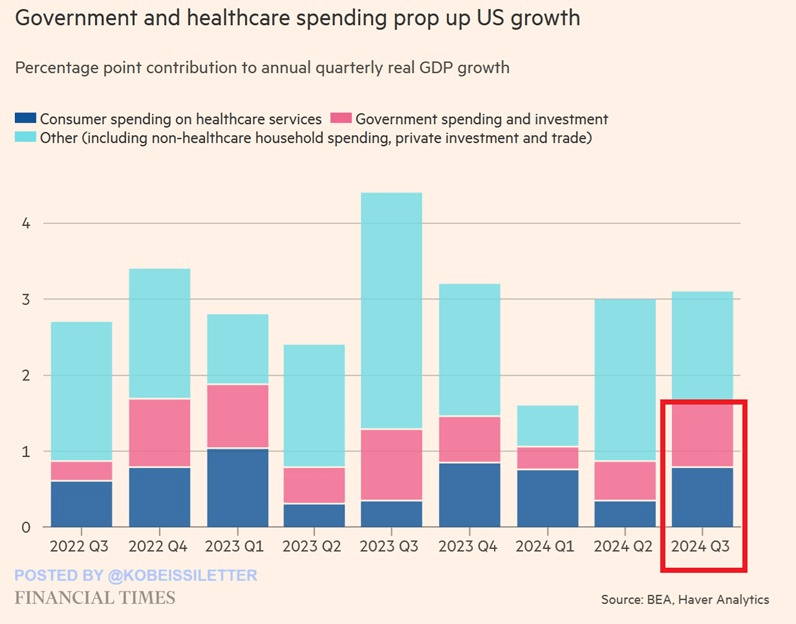
US consumer spending on healthcare and government expenditures accounted for over 50% of US GDP growth in Q3 2024.
Consumer spending on healthcare services alone accounted for 25% of GDP growth in Q3 2024. Government spending accounted for 28%, a combined total of ~53%.
The majority US economic growth now comes from healthcare and the government through taxes and debt.
Since January 2023, the government has created more jobs than the tech, finance, construction, and manufacturing sectors COMBINED.
If DOGE continues cutting these jobs, the Fed will be far more likely to accelerate rate cuts in the coming months.
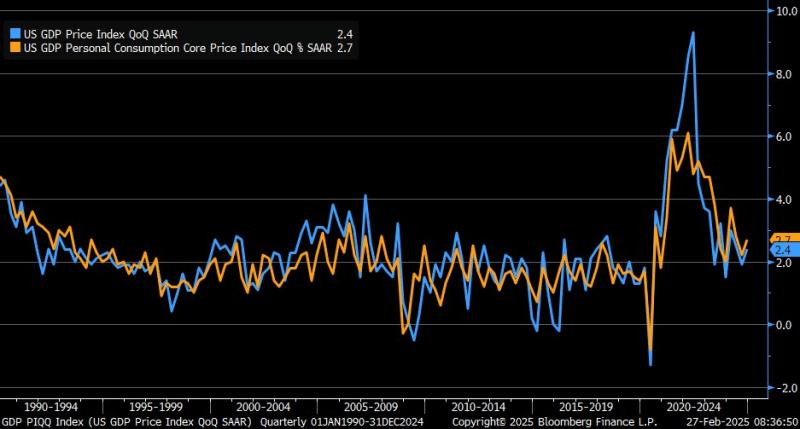
What It Is: Personal Consumption Expenditures: Measures how prices are changing in the economy. Core PCE excludes certain things that can make the numbers look more volatile, like food and energy. The PCE is the Fed’s preferred inflation metric.
Both the PCE (blue) and Core PCE (orange) components of GDP were revised higher for the fourth quarter of 2024, with PCE moving up from +2.2% to +2.4% and Core PCE moving up from +2.5% to +2.7%.
What It Means: Inflation numbers revised higher reduce the Fed’s ability to cut interest rates in the months ahead
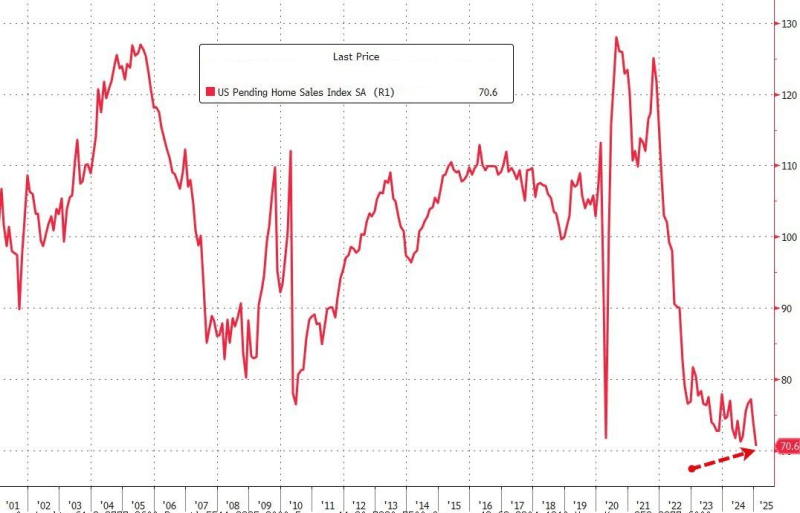
While existing home sales report showed a decline of 4.9% month-over-month, pending home sales fell 4.6% month-over-month and 5.2% year-over-year. The drop pushed the pending home sales index to its lowest level in history (taking out the 2008 financial crisis and Covid lows).
The index measures economic vitality in 200 large metropolitan areas and 203 small metropolitan areas by assessing performance of the labor market, tech sector, and access to economic opportunities. The 2025 version of the index emphasizes jobs, wages, high-tech growth, housing affordability, and broadband coverage, in addition to metrics of community resilience and income inequality.
To ensure that population size doesn’t skew results, the index divides US metropolitan areas into large and small cities, which are then classified into five tiers, with Tier 1 being the highest-ranked cities and Tier 5 being the lowest-ranked cities.
Raleigh, NC ranked as the number 1 city in the country for 2025. Here are the other cities in the Carolinas that made the Tier 1 and Tier 2 lists with their national ranking in (parenthesis).
More people now are renting longer, as mortgage rates stay high and the costs of homeownership remain unaffordable for many Americans. Landlords say that the new construction pipeline should be mostly drained by year-end, setting the stage for rents to rise nationwide later this year.
The relationship is going to very quickly flip from a renter-friendly environment to a landlord-friendly environment,” said Lee Everett, the head of research and strategy at multifamily giant Cortland.
By the end of this year, every major metropolitan market is expected to see positive rent growth, said Jay Lybik, national director of multifamily analytics at CoStar.
More tenants are in heated battles for vacant space. Last year, an average of nine prospective renters were competing for every open apartment unit on the market, according to Rent Cafe.
Apartment absorption, a metric of rental demand that measures the change in how many units are leased, was higher last quarter than any other fourth quarter since at least 1985, according to real estate firm CBRE.
Apartment investors are placing bets on the Sunbelt’s 2025 rebound. Equity Residential, a publicly traded multifamily landlord, paid more than $274 million in the fourth quarter for three properties in Atlanta and Denver.
Some investors that previously exited the Sunbelt market are returning. After selling all of its Sunbelt properties three years ago, Gaia Real Estate, a national real-estate investment and management firm, told The Wall Street Journal that it launched a new Sunbelt-specific acquisition arm with Raymond James as its investment bank. The new REIT has already bought three Sunbelt properties. “We assume that the second half of 2025 [into] 2026 will be back to rent growth,” said Gaia CEO Danny Fishman. “We are playing the wave.”
______________________________________
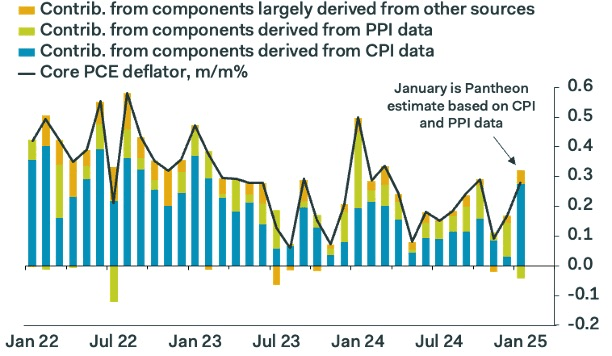
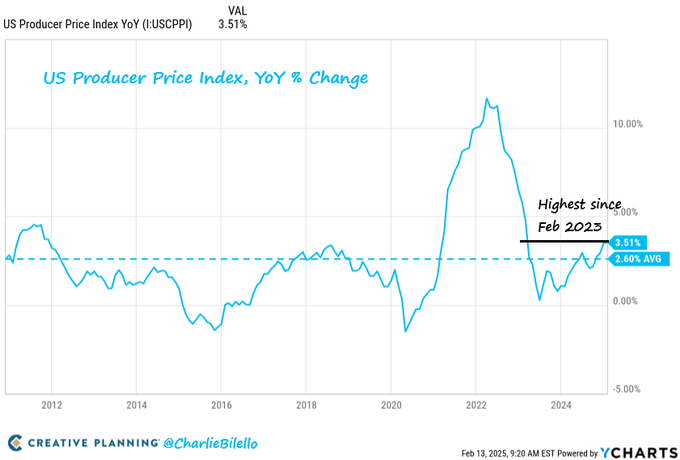
The PPI numbers were a game-changer for the Core PCE print coming at the end of the month (Core PCE is the inflation gauge the Fed believes is most important). We’re now tracking 0.28% month-over-month, 2.6% year-over-year (down from 2.8% in December) All the healthcare and insurance PPI components were weak and airline fares prices fell sharply. About as good as the Fed could have hoped for.
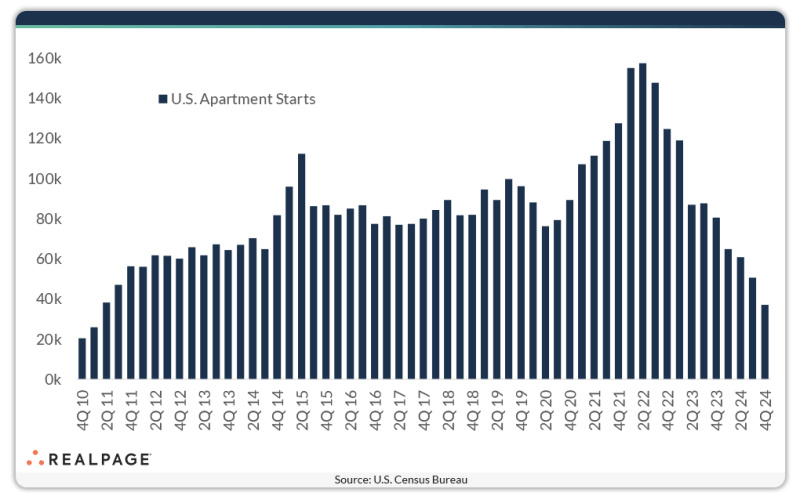
U.S. multifamily starts have declined precipitously in the past year and a half and hit a 13-year low mark in 4th quarter 2024. A little over 37,000 apartment units got off the ground in the last three months of the year.
___________________________________________
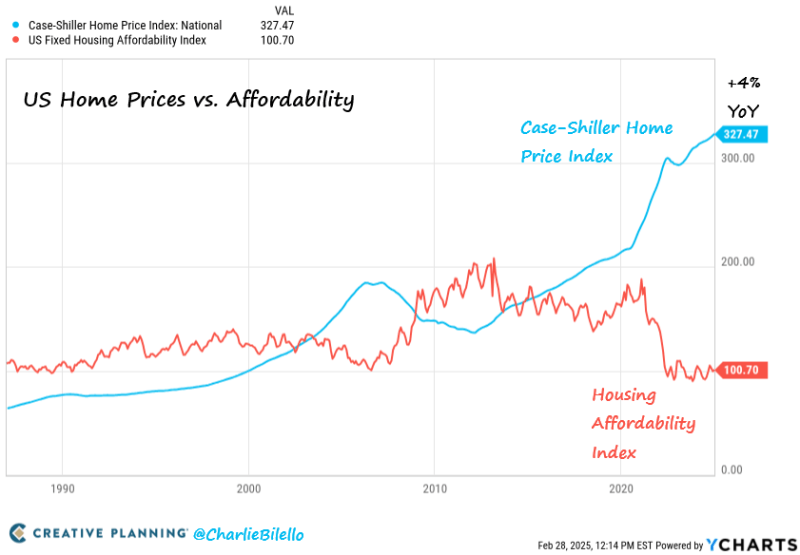
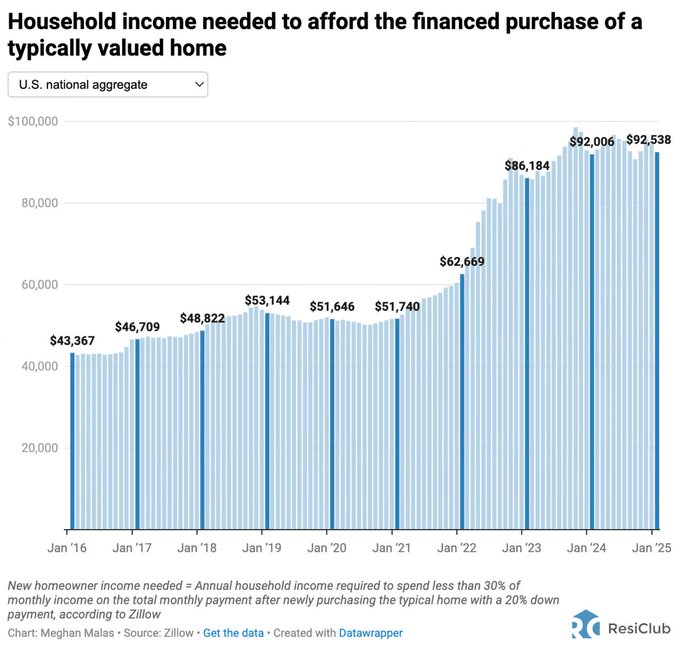
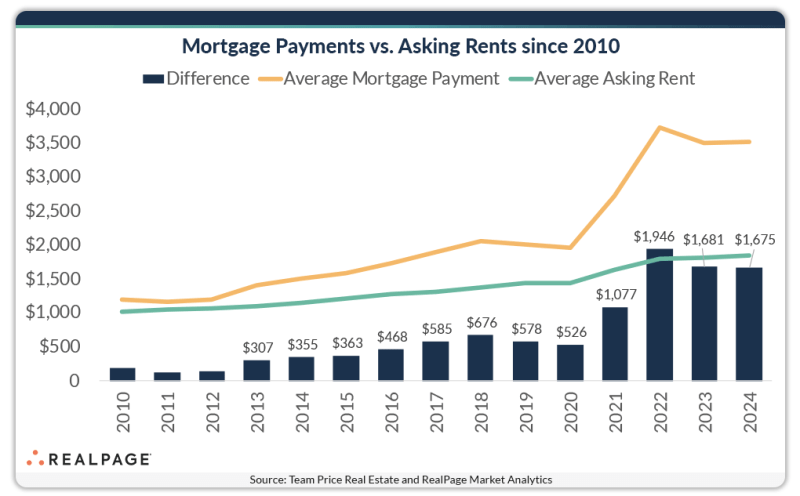
Average hourly earnings in the U.S. grew at an average annual rate of 3.1% between 2010 and 2024. However, during the same time period, the median price of an existing single-family home rose much faster at an average annual rate of 6.7%, more than double the pace of wage growth. By the end of 2024, the median home price had reached approximately $418,000, nearly doubling from $212,000 in 2014.
Rental affordability has followed a different trajectory. The median rent-to-income ratio stood at 22.2% at the end of 2019, peaked at 23.8% in 2021, and then declined to 23.3% by the end of 2023. By the end of 2024, it had settled at 22.5%, just 30 basis points above pre-pandemic levels. This suggests that as inflation has cooled, wages have grown steadily and rents have stagnated over the past few quarters, making renting nearly as affordable as it was before the pandemic, with some variation across markets. In contrast, homeownership has not seen the same affordability improvements, as home prices remain significantly higher relative to income growth.
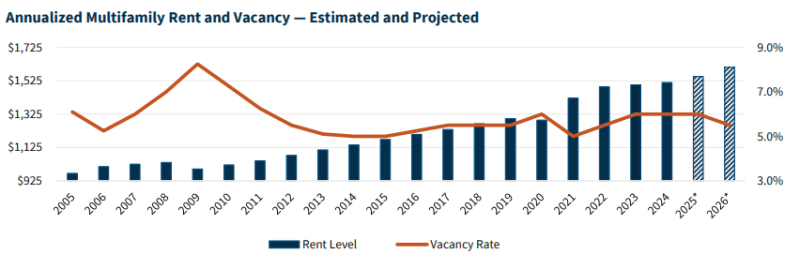
We have upgraded our outlook for the national multifamily sector to “improving” for 2025. We expect the multifamily sector will see slow but continued improvement in demand this year, possibly resulting in flat rent growth and a slightly rising national vacancy rate during the first quarter of 2025 due to the amount of new supply entering the market, especially during what is normally a slow lease-up time of year. After that period, we expect multifamily fundamentals will strengthen, with moderately increasing rent growth and stabilizing vacancy levels.
We anticipate that cap rates are likely to compress a bit more during 2025, likely declining to between 5.0% and 5.5% over the next 12 to 18 months, helping to spur more sales transaction volume over that time.
At a national level, we believe that demand for multifamily rental will increase slightly in 2025, based on expected job growth and household formations as well as demographic trends. As of 2022, there were an estimated 68 million people between the ages of 20 and 34 years old, which is the cohort most likely to rent a multifamily unit. The U.S. Census Bureau estimates that this cohort could increase by nearly 1.0% by 2032 — meaning an increase of more than 670,000 people in this age cohort in just a decade. This growth is one key reason we expect demand for multifamily rental to continue over the long term. In the short term, a rise in new jobs is the other reason. Year-over-year job growth is expected to remain positive through at least 2026, according to Fannie Mae’s latest economic forecast. We expect the economy will add an estimated 4.5 million new jobs between 2024 and 2026. This should help keep new multifamily rental demand steady over the next few years.
Although there are currently more than 632,000 multifamily rental units slated for completion in 2025, we believe it is very unlikely that all those units will be completed before year end, due primarily to ongoing labor shortages and construction delays, notably permitting delays.
2024 was a banner year for multifamily absorption. More than 436,000 units were absorbed – a 72% increase over 2023 and 56% above the 2017-2019 average. Every one of the 90 markets tracked by Cushman & Wakefield Research posted more net move-ins than move outs, with the Sun Belt continuing to lead in growth.
Construction risk is quickly diminishing. Construction activity has fallen 40% from its peak, with new starts down to just 230,000—the lowest level since 2012. High interest rates, weaker effective rent growth, and rising replacement costs continue to hinder new development. Most apartments slated for delivery by 2028 have already broken ground, setting the stage for a tighter supply environment over the next three to four years.
Investors are coming back to the multifamily market with a vengeance. Volume increased by a healthy 22% in 2024, leading all asset classes. Consistent monthly activity indicates the market has turned a corner. Investors are intrigued by the confluence of peaking supply-side pressure, limited new groundbreakings due to elevated borrowing costs, and the high cost of homeownership, keeping renters renewing at historically high levels. This results in a path to rent growth in the quarters ahead. Additionally, many deals are being done below replacement costs, and capital is coming off the sidelines.
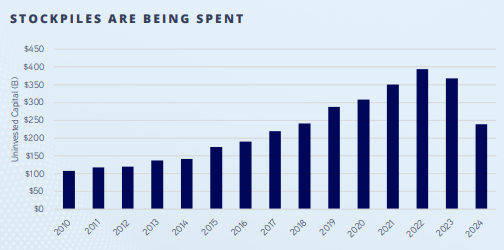
Investors are deploying their capital stockpiles, and there is no reason to suggest that multifamily won’t receive its fair share. Timing is important, and with signs of brighter days ahead, expect investors to continue chasing multifamily assets in 2025.
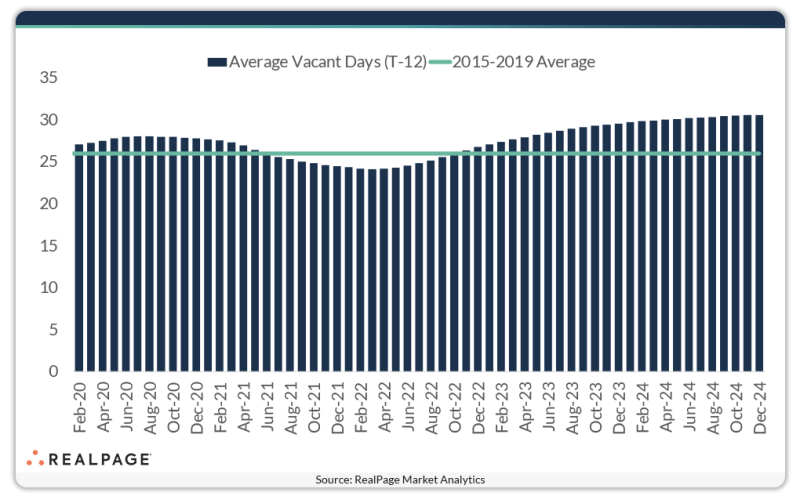
With the delivery of more than one million new market-rate multifamily units over the last two years, renters now have more options to choose from than ever before. That has softened occupancy rates and resulted in units sitting vacant for longer. The average number of days a stabilized unit sits vacant before a new tenant moves in is nearly five days longer than it was on average in the five years prior to 2020.
The variance to historic levels may seem miniscule, but extended vacancy works out to an additional $275 per unit in expenses and turnover costs (based on current average. U.S. effective rent of $1,818 as of January 2025). With more than half a million stabilized units unoccupied, the additional impact to property operations quickly adds up.
____________________________________
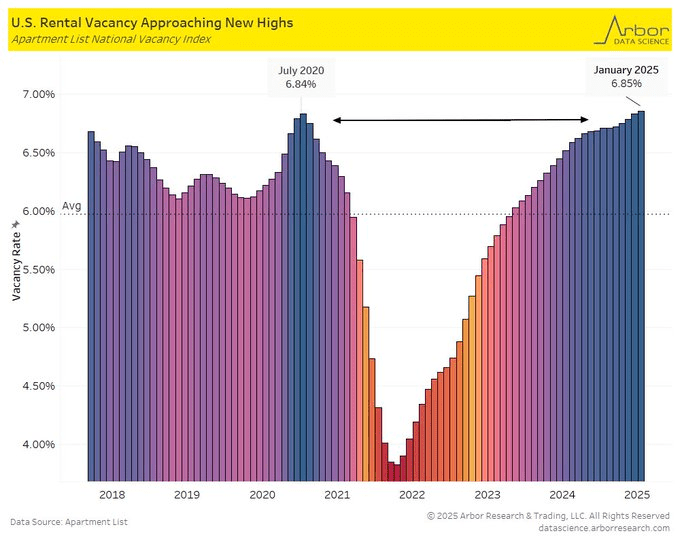
U.S. rental vacancy rate from ApartmentList has surpassed the July 2020 peak, up to 6.85%:
What It Is: Truflation is an independent, real-time inflation index that aims to provide a more accurate and transparent measure than the government’s CPI metrics. It’s like a live inflation scoreboard due to its real-time data.
What It Means: The graph below shows that bond yields have tracked with the Truflation percentage and if the trend holds, now forecast a significant drop coming in the 10-year treasury yield.
What It Is: Tracks a basket of commons items people by like food, gas, rent, healthcare and clothing. Compares the prices to the previous month and provides percentage change.
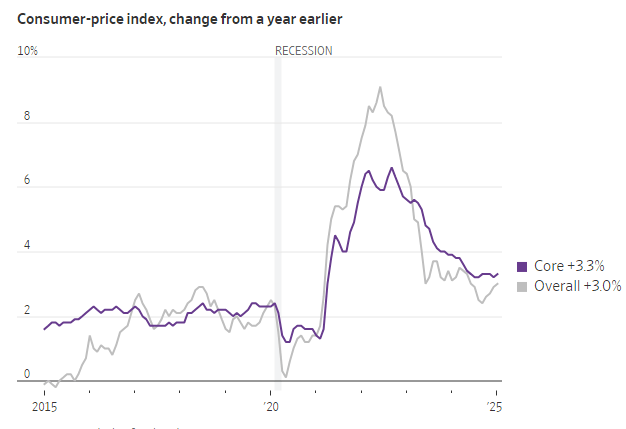
Jumped 0.5% on the month and brought the annual rate up to 3.0%, which were higher than expected
This is the seventh straight month of accelerating month-over-month CPI prints
Core CPI, which removes more volatile food and energy prices, rose 0.4% monthly and 3.3% annually, which were higher than expected
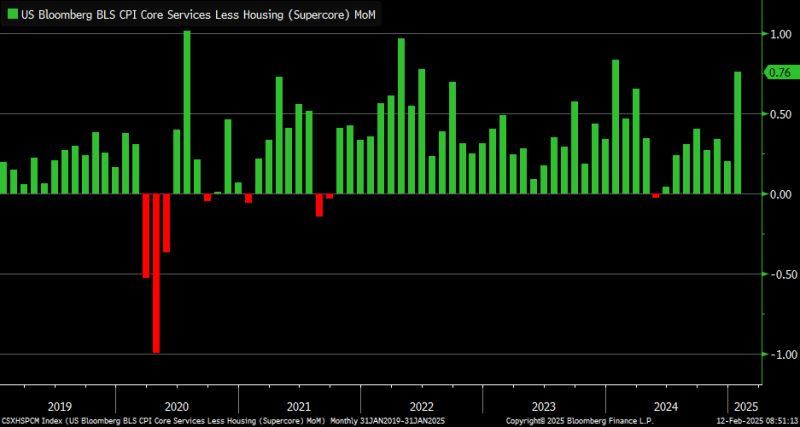
The Supercore CPI (excludes food, energy and shelter) exploded higher to 0.7% month-over-month bringing the annual rise to 4.0%
What It Means: A hotter than expected CPI report makes the Fed less likely to cut interest rates in the coming months