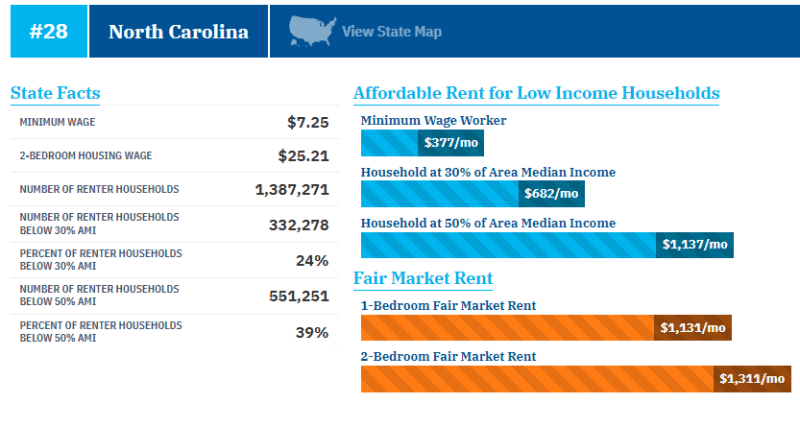
The 2024 “housing wage” for North Carolina is $25.21 per hour, which is an increase of $3.61 an hour when compared to the $21.54 per hour wage a worker needed in 2023 to pay for a modest apartment.
The “housing wage” is an annual estimate of what a full-time worker would have to earn per hour to afford a modest apartment at Fair Market Rent without spending more than 30% of their income on housing.
Here are the five areas in North Carolina with the highest required housing wages:
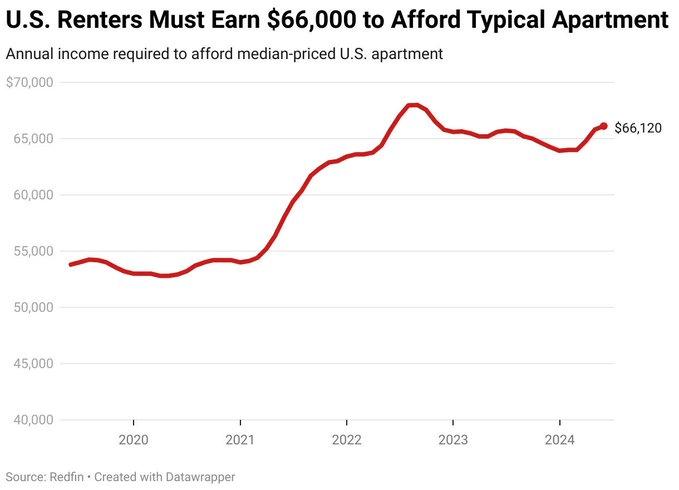
The typical U.S. renter household earns an estimated $54,712, which is 17.3% less than the $66,120 they must earn to afford the median U.S. apartment rent ($1,653).
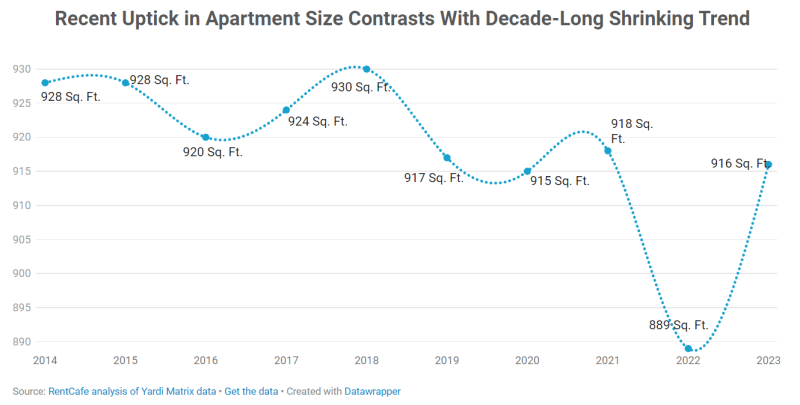
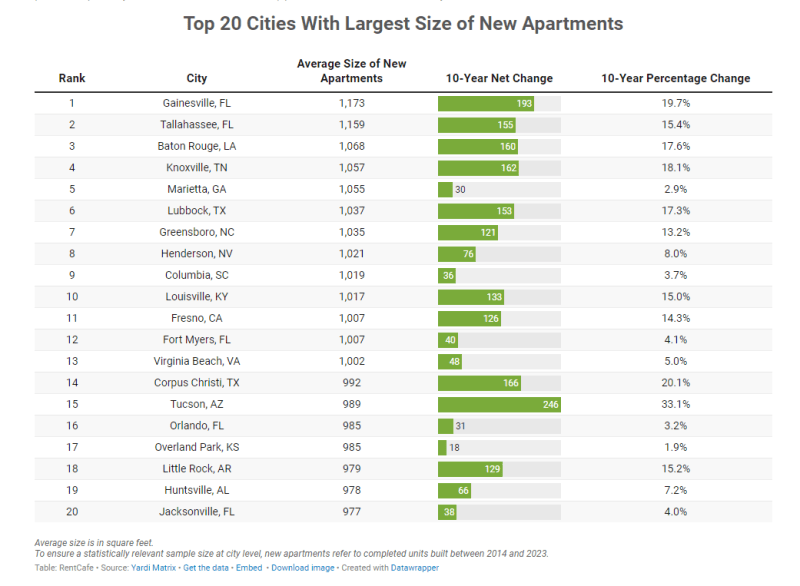
The average size of new apartments in the U.S. saw substantial growth in 2023, bouncing back to 916 square feet after a steep decline the previous year. This increase can be attributed to more spacious two- and three-bedroom apartments opening their doors last year as developers aimed to meet renters’ need for more space.
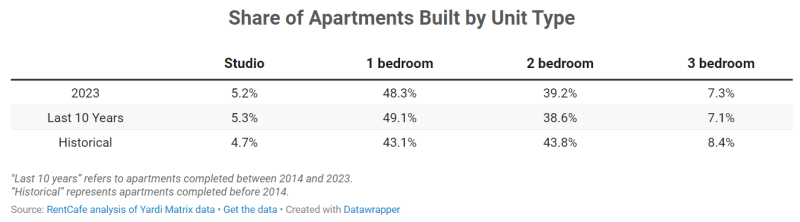
However, looking at what was built last year, one-bedroom apartments still dominated construction, comprising the largest share of new apartments (48.3%). This was also one of the factors that pushed down the average size of apartments in the last 10 years — a trend that persists despite the recent uptick.
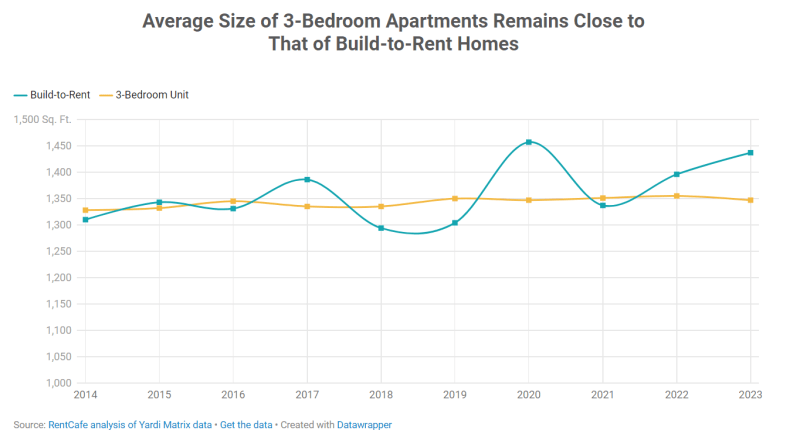
The average size of a single-family home for rent increased to 1,437 square feet in 2023. That’s 41 square feet more than the year before and second only to the numbers in 2020 (1,457 square feet).
Three-bedroom apartments have been steadily getting roomier and remain close to single-family homes for rent in terms of floor space and rent costs:The size of a build-to-rent house increased to more than 1,400 square feet in 2023 for an average rent of $2,096, while the norm for a three-bedroom unit was close to 1,350 square feet and $2,160 in monthly rent. This is why, in some locations, renters might find it more convenient to rent a house as opposed to a three-bedroom unit.
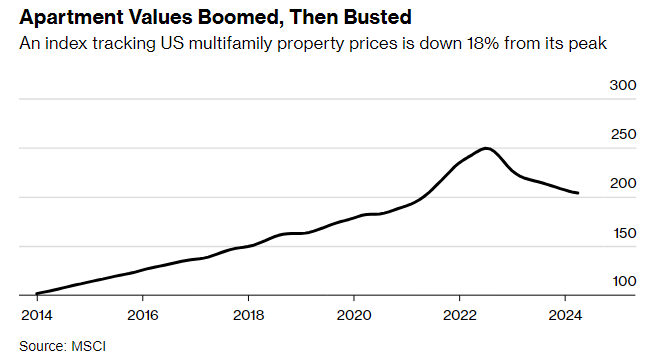
By June 2022, all sorts of trouble began to appear at once. The Federal Reserve had started hiking interest rates at the fastest pace in a generation. A swelling supply of newly built apartments contributed to flattening rents. And as the debt market dried up, sales of apartment buildings plummeted to $28 billion in the fourth quarter of 2023, down more than 80% from two years earlier, according to MSCI.
Rents have continued to ease, with a measure of those costs falling 0.8% in the 12 months ending in May 2024, according to Apartment List.
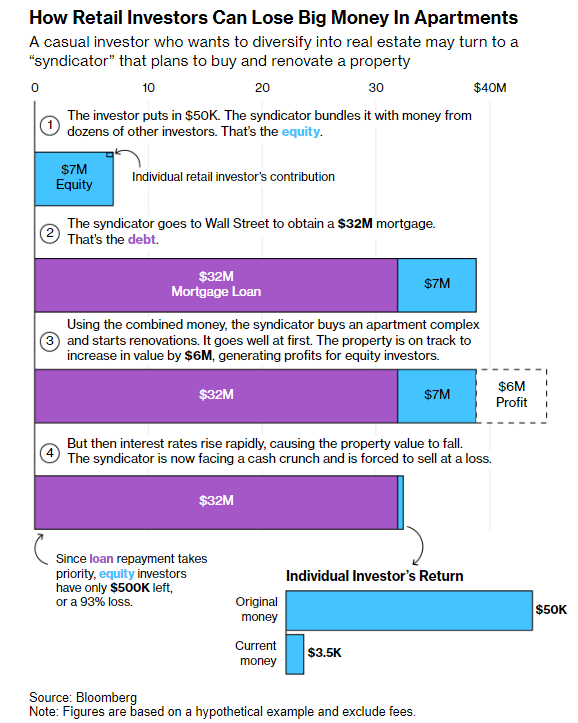
Large institutional players who bought buildings with traditional financing, without as much leverage, were in a better position to weather the turmoil and hold onto their buildings until values appreciated. But the floating-rate debt that had supercharged profits when rates were low has become a millstone for some syndicators. With loan payments soaring and capital for renovations drying up, they risked losing buildings to foreclosure or selling for a loss, with equity investors typically last in line for payment.
The data points to a shift away from living close to workplaces. The widespread adoption of hybrid work—allowing employees to do their jobs from home on certain days—is the key driver.
Research from Gusto, a payroll and benefits software company, shows that younger employees and high earners—defined as those who make over $250,000—are choosing to live farther away from their offices.
The average distance to work rose to 27 miles at the end of 2023 from 10 miles in 2019, according to Gusto’s study of 52,000 employees at more than 6,800 businesses. Among employees in their late 30s, that distance nearly tripled to 29 miles.
Higher interest rates, tighter lending conditions and flattening rents in parts of the country have left property companies from California to Florida waiting for financing that might not come soon.
The amount of time the average apartment project spends between construction authorization and when construction begins has risen to nearly 500 days, a 45% increase from 2019, according to property data firm Yardi Matrix.
Developers also are launching fewer projects amid the financing crunch. Multifamily building starts fell to an annual rate of 322,000 units in April, the lowest April rate since 2020, according to the Census Bureau.
While most developers get tripped up before real activity begins, a few have found trouble after starting construction, leaving them with half-built properties.
About half a million new apartments opened in 2023, the most in 40 years. Based on what is already under construction, analysts expect a similar number to be completed in 2024.