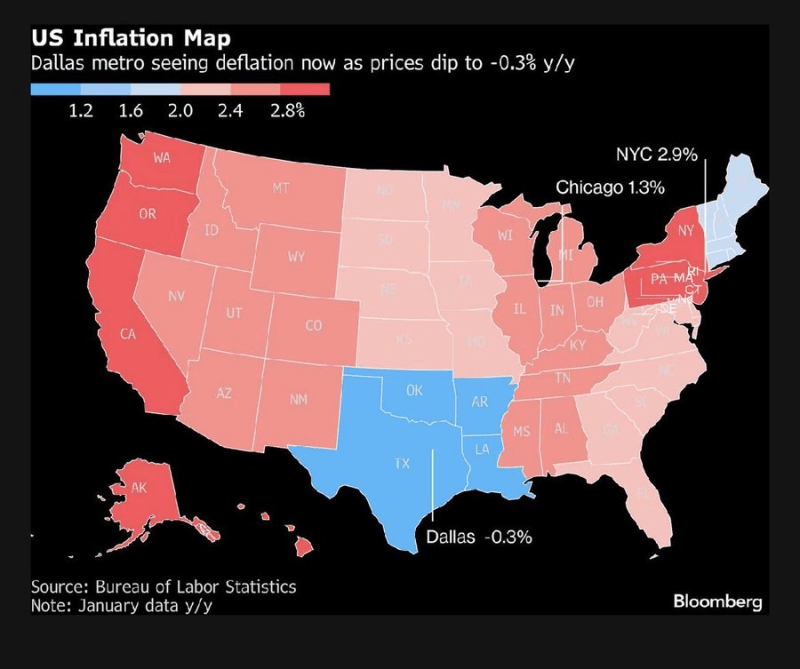
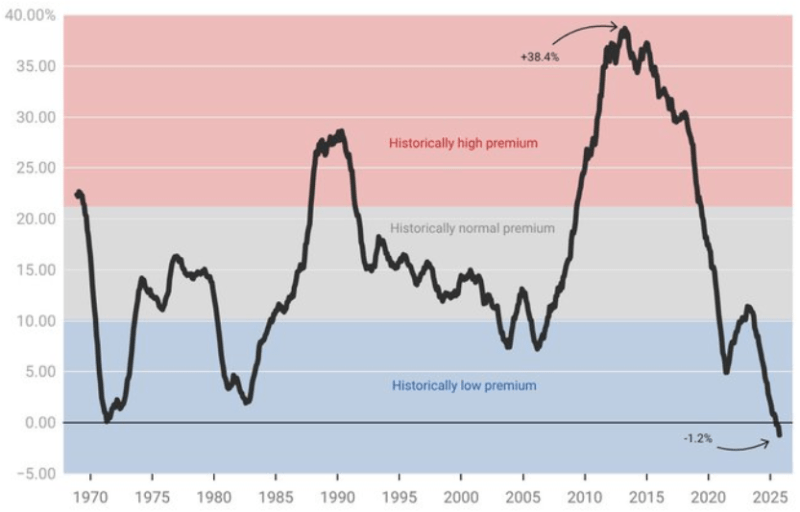
It’s been a tough decade for Apartment REITs so far:

Source: John Burns
All commercial property prices were up year-over-year through October:

Over the past year, more than half (53%) of homes have lost value, the highest share since 2012. This share has climbed from only 16% just a year ago.
Since July of 2022, most homes have fallen from their peak value. The average drawdown of all homes is 9.1%

Source: Zillow
The affordable (rent restricted) multifamily sector is facing unprecedented margin pressure as operators confront a structural mismatch between revenue and costs.
Expenses at affordable communities have risen 38% since 2019, while income has only increased 32% over that same period.The six-point spread is not just a financial statistic but a lived reality on the ground, visible in tightening margins, deferred maintenance, and growing vulnerability to even modest external shocks.
Actual transaction data confirms NOI growth has been under acute pressure over the last several years, a phenomenon not seen with the same intensity on the market-rate side. While property-level revenues have trended upward in step with increases in area median income, expense growth has been less forgiving, driven primarily by surging payroll, maintenance, and utility costs. In many jurisdictions, these line items are up four to five percent year over year—a rate much higher on the affordable [side]…than on the market rate world.
The gravity of this trend becomes starker at the market and even sub-market level. In cities like Charlotte, operators have reported particularly acute challenges, where the expense load has been extremely difficult.
Some limited relief has come from a recent slowdown in insurance cost spikes, but this is far from enough to offset broad-based expense inflation.
The squeeze challenges the notion that affordable housing provides stability for both residents and owners. Turnover, typically much lower in affordable communities than in market-rate ones, has in some cases reached parity—a worrisome trend that may signal growing instability. Operators are forced to operate leaner, often delaying both routine and capital-intensive work.
Regulatory complexity itself is both a symptom and driver of higher operating costs, as subsidy layering and compliance requirements add about $20,000 per unit in development cost and significantly extend timelines, further stressing the operational side.
Source: Globe Street
The fall 2026 U.S. student housing pre-lease season started with the slowest October in over a decade with only 3.3% of privately owned student housing beds leased. In the previous three pre-lease seasons, the lowest reading for October was 7.2%.

Source: Realpage
Source: CoStar
Half of the nation’s 150 largest metro areas cut rents year-over-year through October. Apartment rents are falling in more U.S. markets today than at the height of COVID lockdowns in 2020.

Source: Jay Parsons
The lending environment for multifamily properties showed meaningful improvement during Q3. Multifamily loan spreads tightened by 27 basis points year-over-year to 141 basis points, driven primarily by lower agency loan spreads.
Government-sponsored enterprise (GSE) lending increased dramatically in Q3. Agency origination volume jumped 53 percent quarter-over-quarter and 57 percent year-over-year to $44.3 billion. The average GSE fixed mortgage rate for closed permanent loans with seven-to-ten-year terms fell 13 basis points during the quarter and 27 basis points year-over-year to 5.6 percent.
Multifamily loans spreads have diverged from the rest of commercial property loans:

While investment volumes rose, multifamily property valuations did not. The MSCI Commercial Property Price Index showed multifamily as the only major sector experiencing year-over-year price declines, with values down 0.8 percent in September 2025 compared to the previous year. The index was down 19 percent from its 2022 peak.
The number of properties trading hands declined in the 3rd quarter, however, on an annual basis, both the dollar volume and number of properties trading were up.

The average price per unit was $227,167 in 3rd quarter. The per unit pricing averaged about $151,000 from 2015 to 2019.
Cap rates for apartment transactions occurring in 3rd quarter 2025 averaged 5.63%, the highest cap rate in more than eight years and well above the pandemic-era low of 4.65% from 2nd quarter 2022.

Source: RealPage
