The shelter (rent) component of the monthly CPI inflation report continues to cool, even as the other combined inflation categories ticked up a bit in July.
Year-over-year shelter inflation has cooled in 25 of the past 27 months, from a peak of 8.8% in March 2023 down to 3.8% this month.
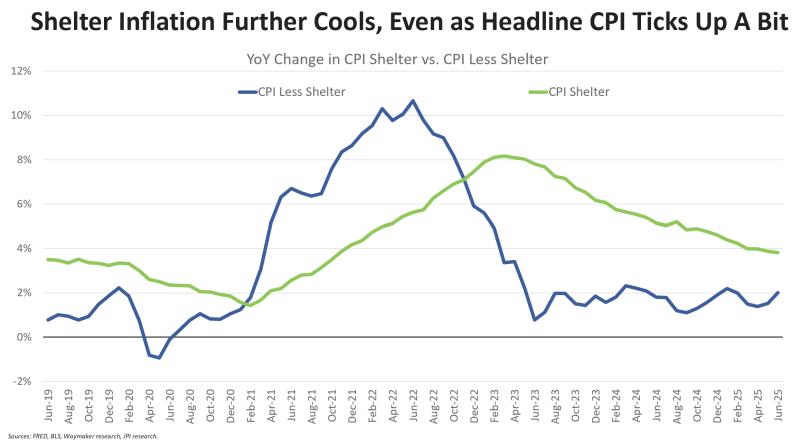
That means rent inflation is back around pre-pandemic levels again. However, the way the BLS measures rent/shelter inflation is deeply lagged and a heavily modeled dataset based on a tiny sample size. Private sector data providers show far more cooling than the BLS does.
If you use real-time rent data from Zillow and ApartmentList, shown in WisdomTree’s graphs below, headline and core inflation are already running well below 2.0% (the Fed’s target):
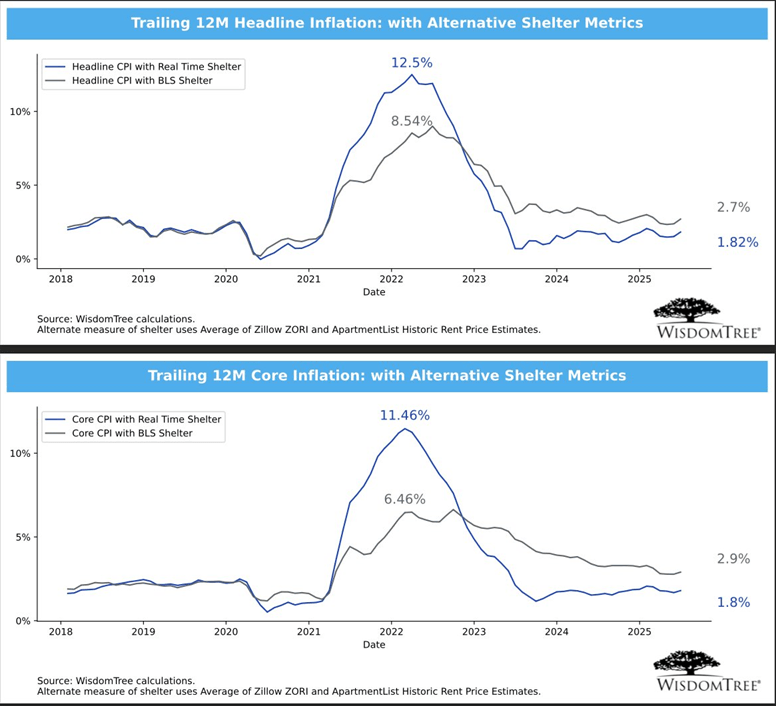
Source: Wisdom Tree & Jay Parsons