
A summary of a recent conversation with Jay Parsons and Chris Porter at John Burns Research & Consulting:
Renter Demand Remains Strong
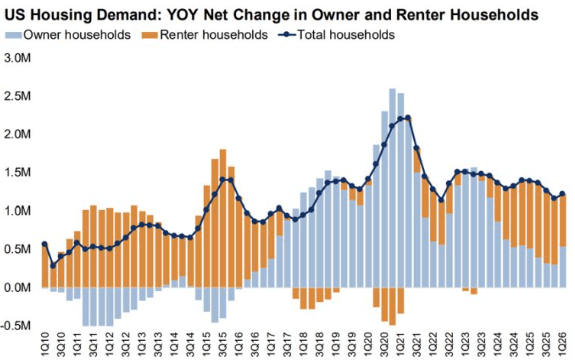
Skepticism about apartment absorption numbers has been a persistent feature of the past two years. Leasing teams look at their own traffic and wonder where all this demand is supposed to be. The private data providers say it is there. Now the census data, as analyzed by Johns Burns Consulting, says the same thing:
- Over the twelve months through the first quarter of 2026, the U.S. added roughly 680,000 net new renter households; about 56% of all household formation in the period.
- Owner household formation has flattened under the weight of prices and rates; renter formation has not.
The important nuance is that this is not simply a story about people being locked out of ownership. A tighter for-sale market slows the exit door on the back end, which flatters the net number, but it does not by itself manufacture new renter households. Most of that 680,000 represents genuinely new households forming, and the great majority of them are renting first.
Young Adults Staying Home With Parents
- The share of 25-to-34-year-olds living with parents now stands at 18.8%.
- The long-run average from 1997 through 2025 is around 13%.
- That is a swing of more than 500 basis points, or roughly 900,000 additional young adults living at home compared with a few years ago.
The trajectory is what surprises people. The number fell from 2020 through 2024, precisely the stretch when rent inflation was at its hottest, and then reversed sharply in 2025 and into 2026.
Driver is confidence, and that confidence deserves to be split in two:
- Consumer confidence measures how people feel about their situation today.
- Consumer sentiment measures how they feel about what’s coming.
Sentiment is the one sitting at record lows, worse than the depths of the financial crisis, and it is weak even among people who are gainfully employed. Nobody makes a large, irreversible decision when they cannot see the next twelve months clearly. That shows up first in home buying, but it shows up almost as fast in the simpler decision to sign a lease and move out.
Several other factors compound it. The work-from-anywhere window that let people relocate to cheaper markets has largely closed. Pandemic-era stimulus is long gone. Grocery and housing costs are pressing on the same budgets. And the cultural read has shifted: what was once framed as failure to launch is now is now framed by many as a financially savvy move, and plenty of parents are genuinely fine with it.
For owners and operators, it is a temporary demand loss, but it’s also a pent up demand deferral; these are households that will eventually form, and renting is the first stop for nearly all of them.
This Is Not A Recent Phenomenon
- The share of 30-year-olds living independently was 83% in 1985. It’s 67% today.
- Marriage rates among 30-year-olds have fallen faster still.
- Kids and homeownership are down over the same period.
This decline has persisted through expansions and recessions, tight labor markets and slack ones, cheap money and expensive money. It’s continued even as real incomes rose.
Why?
Education explains a great deal. More people pursue post-secondary education, and for a stretch the master’s degree became the new bachelor’s. That is four, five, six years of deferred earning, followed by debt that trails the graduate for years or decades. Every downstream milestone (the job, the marriage, the kid, the house) gets pushed back accordingly.
The practical takeaway is that the renter stage of life has structurally lengthened. Someone buying a home at 32 instead of 26 is still buying a home. But those six years belong to the rental market, and there are a lot of them in aggregate.
Immigration: A Real Issue, Unevenly Distributed
Immigration policy is a genuine macro variable for housing demand. It is not, however, a uniform one:
Roughly 70% of recent immigrants from high-encounter countries, largely Central and South America, live in properties with fewer than 50 units. These are older, cheaper, sub-institutional buildings, the kind the industry stopped constructing decades ago. Household sizes among this group run around five people, against about two and a half for domestic-born households.
That profile does not overlap much with institutional Class A product or Class A build-to-rent. If immigration stays constrained, the pressure lands squarely on Class C and the mom-and-pop rental stock, with only indirect effects further up the quality ladder.
There is a geographic caveat worth keeping in mind: immigration is not one flow. A decade ago the story in expensive coastal markets was capital arriving from Asia (people flying in with money, not crossing a border) and that cohort does land in institutional-grade product. The composition of immigration matters as much as the volume, and it varies market by market.
One more channel deserves attention. An analysis of government data shows student visas down 7% year-over-year. That is a concentrated problem, not a national one. Boston is the obvious case, a market built on a steady inflow of international students, where operators are reporting the shortfall not just in purpose-built student housing but in the market-rate product that serves the same population.
The Forecast: Strong Now, Moderating Later
John Burns researchers project roughly 480,000 net new renter households per year over the next five years, across apartments and single-family rentals combined. That compares with about 540,000 annually from 2021 through 2025, which was an exceptionally strong period.
2031–2035 is projected to run closer to 270,000 net new renter households annually.
Births in the U.S. peaked in 2007, which means 2025 was the year of peak 18-year-olds. That cohort will be making rental housing decisions for the next ten to fifteen years. On top of it sits the pent-up demand from everyone currently at home. And a higher share of the population rents at every age group than twenty years ago.
The longer-dated view is more cautious, and reasonably so; ten-year demographic forecasts carry real error bars. But slower and still positive is a workable planning assumption.
The Rent-Versus-Own Gap Is Not Closing
John Burns tracks the all-in monthly cost of ownership for a new buyer (principal, interest, taxes, insurance) against the cost of renting. Nationally, owning runs about $1,000 per month above renting a house and roughly $1,700 above renting an apartment. Across the 33 major markets, the average gap is wider still.
The dispersion matters. In Chicago, Minneapolis, and Indianapolis the gap is narrow enough that the rent-or-own math is close to a coin flip. In California it is prohibitive, which is a large part of why homeownership rates there sit where they do.
Can it compress? John Burns researchers are skeptical in the near term. Home prices are rising again in most markets. Futures markets imply mortgage rates hold in the low-to-mid 6s. Taxes and insurance (the components buyers forget until they see the escrow statement) keep climbing. Their view is that income growth, not price declines or rate cuts, is the realistic mechanism for improving affordability, and that is a chipping-away process rather than a step change.
There is a further wrinkle. The scenario in which rates fall enough to materially close the gap is probably a scenario with real economic distress, which is not a scenario in which rents are rising. It is difficult to construct a path where the gap narrows quickly and the rental market is healthy at the same time.
What The Aging Population Actually Means
The conventional pessimist’s case is that an aging population is bad for housing across the board. The student housing market suggests a more interesting analogue.
Student housing has faced flat-to-declining college-age population growth for several years. The effect has been anything but uniform: the Power Four and marquee private institutions continue to boom while regional and lesser-known schools struggle or shrink. Haves and have-nots, sorted by desirability rather than by macro trend.
John Burns researchers expect something similar in housing more broadly. The overwhelming share of population growth over the next decade comes from the 70+ cohort, a notable shift, since the boomer conversation has for years centered on the 60-to-65-plus range. There is also growth in the 25-to-54 band as Gen Z and millennials age into it.
Older households are good for rental housing in ways the doomer case misses. People live independently longer. Many eventually decide they would rather someone else handle the roof and the HVAC, and they rent by choice.
But the 70+ population is not monolithic. Some have portfolios in excellent shape after a long bull market; others face a longer retirement than they funded. That divergence propagates downward. The inter-generational wealth transfer everyone has been discussing for a decade is real, and increasingly it is reaching grandchildren rather than adult children, and it arrives before death as often as after. Households that receive it get a foot in the door, whether that door is a rental or a purchase. Households that do not, do not.
For investors, the implication is a location one. The winners of that transfer will spend it on being where they want to be; near jobs, retail, restaurants, activity. Bet on the neighborhoods, not just the MSAs.
Product: Is It Time To Build Bigger?
If people are renting longer, they are increasingly renting through life stages that used to belong to ownership; raising kids, needing a home office, wanting a yard. The past two decades of development pushed the opposite direction: more studios and one-bedrooms, a shrinking share of twos and threes.
John Burns researchers see single-family rental and build-to-rent as the natural fit for the family formation piece: more bedrooms, a yard, space to spread out. But they do not think the demand is limited to households with children, and they see room for apartment developers to segment and diversify product rather than concede the category.
There’s a more specific way of framing the opportunity: There is a renter who wants to stay in the walkable, interesting neighborhood (not yet worried about school districts, not ready for a house in the suburbs) but who wants one more room. Or an older renter whose income has risen, who likes the amenities and the lack of maintenance, and who wants an office. Or they’re in the “baby maybe” household: a couple thinking about starting a family, not there yet, who want a den that could become a nursery. Not every submarket supports it. In the right ones, it looks like a genuine gap.
On the single-family rental side, the demographics skew older, more married, more likely to have children than the typical apartment renter. One large operator has publicly stated that roughly 90% of its residents could not qualify to purchase. But there is also a renter-by-choice segment; people who could buy and prefer the flexibility, often because they are not certain they will stay in the area or have not settled on a neighborhood.
Three Data Caveats Worth Carrying Around
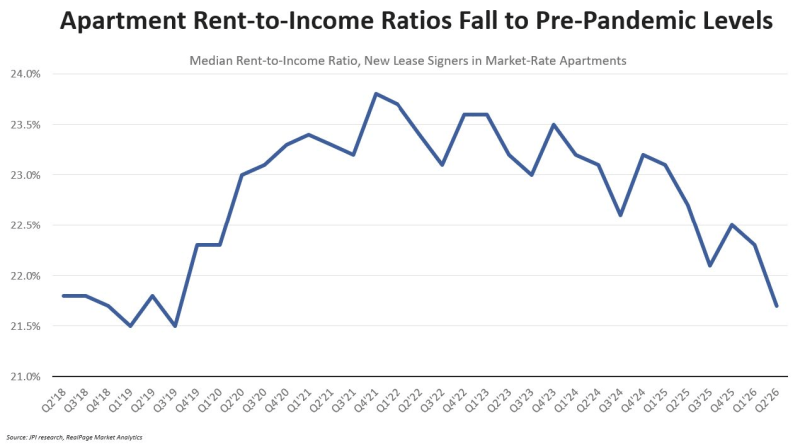
1. CPI rent is not a usable input. When someone argues that real wages are not keeping pace with rents, check what they are using to measure rent. CPI’s rent component draws on a small monthly sample, surveys each household roughly twice a year, and applies heavy modeling on top. The result lags reality and smooths it. There is better, more current data available from CoStar, RealPage, and others — and that data shows rent-to-income ratios declining among people actually signing leases. It is also worth noting that John Burns data shows inflation-adjusted wages for today’s young adults running higher than for any previous generation, whatever else may be true about how that income gets spent.
2. Census multifamily starts are unreliable. The reported “surge” in multifamily construction is a methodology artifact; the census is catching up on starts it missed at the peak. There has likely been some genuine uptick, but nothing resembling a surge. Private-sector trackers devote substantially more resources to the question.
3. Homeownership may be measured wrong. A Federal Reserve Bank of Minneapolis paper proposes a person-based measure rather than the traditional unit-based one. The official 65% figure reflects the share of housing units occupied by owners. Measure instead the share of adults who are homeowners and the number drops to 53%. The gap is precisely the population discussed above — adults living in someone else’s owned home, counted as neither owners nor renters. The implication is provocative: the country is becoming less a renter nation than a multigenerational-household nation.
Domestic Migration
Among large MSAs, Jacksonville led the nation in domestic migration rate in 2025, defined by John Burns as domestic move-ins less move-outs as a share of total moves, which controls for market size. The rate was 5%.
Charlotte finished second and Raleigh third, with San Antonio fourth and Nashville fifth.
 Multifamily Market News