The Monthly PCE Report – released 2/28/25
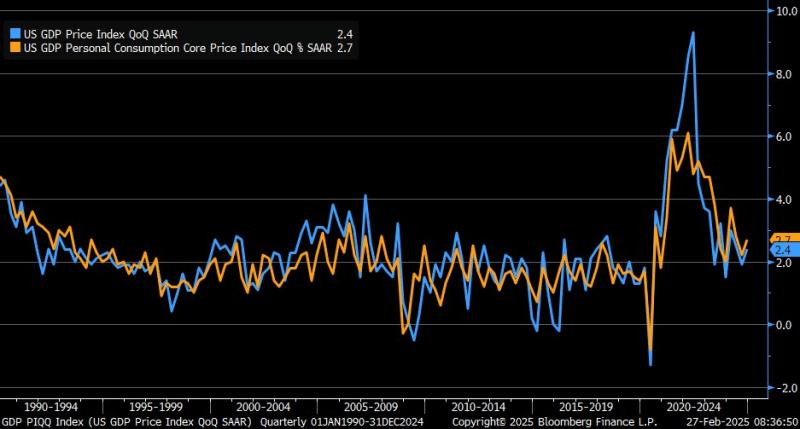
- What It Is: Personal Consumption Expenditures: Measures how prices are changing in the economy. Core PCE excludes certain things that can make the numbers look more volatile, like food and energy. The PCE is the Fed’s preferred inflation metric.
- Both the PCE (blue) and Core PCE (orange) components of GDP were revised higher for the fourth quarter of 2024, with PCE moving up from +2.2% to +2.4% and Core PCE moving up from +2.5% to +2.7%.
- What It Means: Inflation numbers revised higher reduce the Fed’s ability to cut interest rates in the months ahead
_____________________________________________
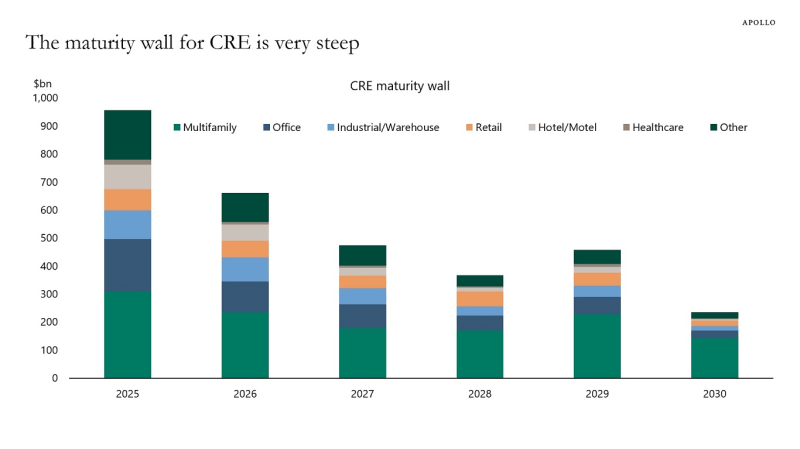
The chart below shows the location in the economy where higher rates equal extreme pain (click here for high resolution chart):
_________________________________________
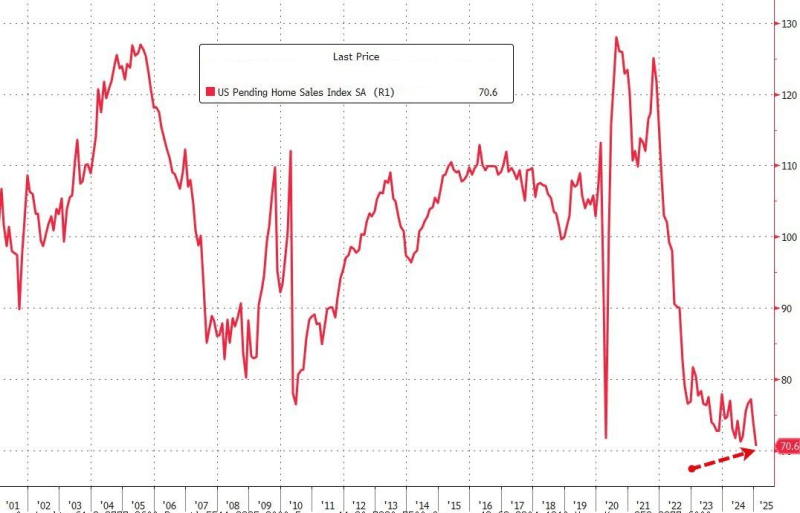
While existing home sales report showed a decline of 4.9% month-over-month, pending home sales fell 4.6% month-over-month and 5.2% year-over-year. The drop pushed the pending home sales index to its lowest level in history (taking out the 2008 financial crisis and Covid lows).
________________________________________
The number of unsold completed new single-family homes hits the highest level since July 2009. New home sales declined by 10.5% month-over-month. A higher supply of homes leading to lower prices (combined with the recent drop in mortgage yields) would improve affordability for those looking to enter the market and reduce the supply of existing multifamily tenants.

______________________________________
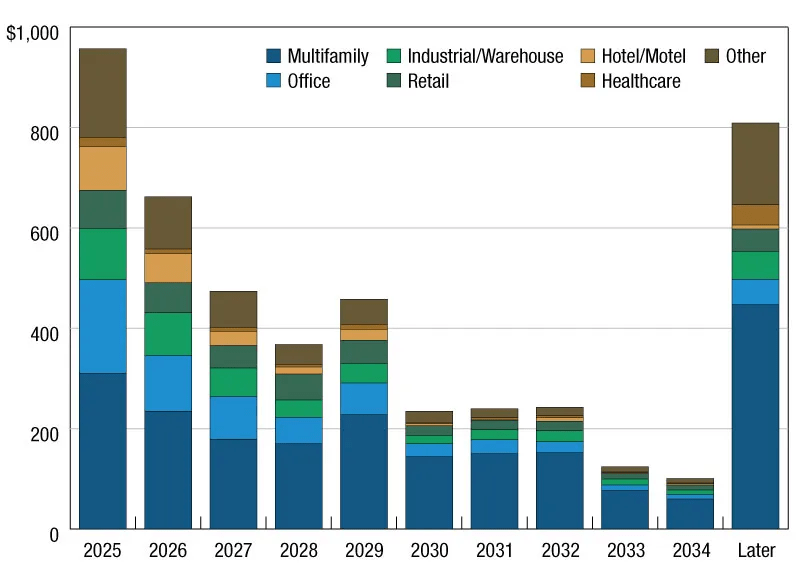
20% ($957 billion) of the $4.8 trillion in outstanding commercial real estate debt will mature in 2025, a 3 percent increase from 2024.
14% of multifamily debt (not including that serviced by depositories) will mature in 2025.