
__________________________________________
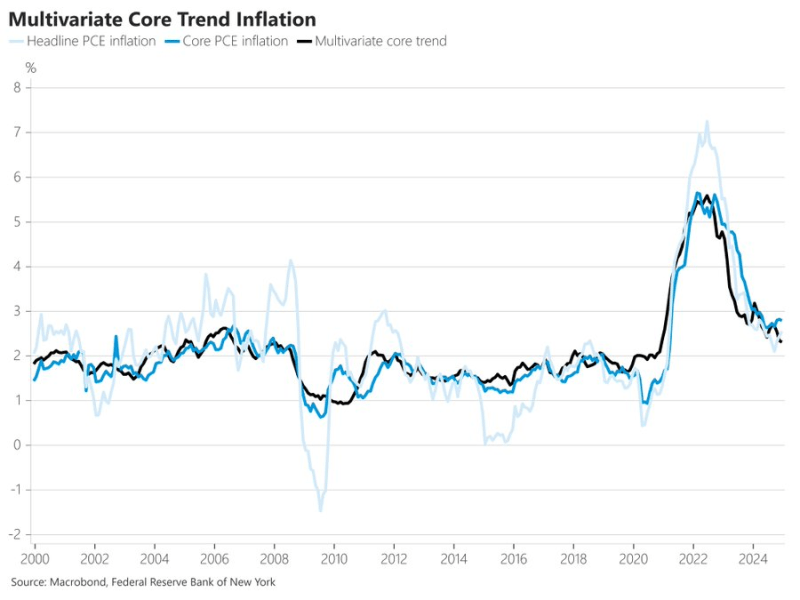
The NY Fed’s measure of inflation persistence (the “multivariate core trend”) fell to 2.3% in December, the lowest level in four years. Almost all of the overshoot relative to the pre-pandemic average comes from non-housing services.
___________________________________
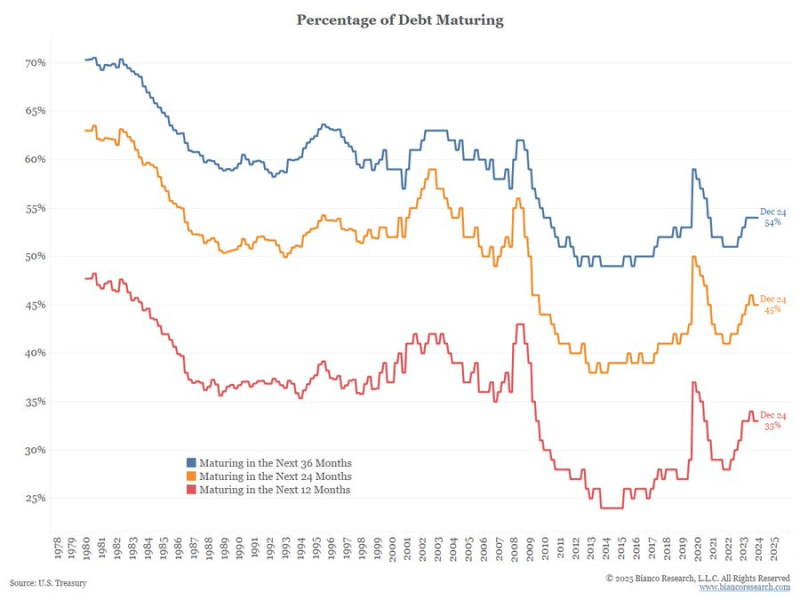
There’s been a fear cycle in the media recently talking about how 1/3 of the federal debt needs to be refinanced in the next year (and how this will negatively impact treasury yields). In reality, 1/3 of the debt always needs to be refinanced in the next year and about half always needs to be refinanced in the next 3 years. See below going back to the late 70’s:
____________________________________
The number of 1-person households continues to rise in the United States. Obviously, 1 person living alone has a far lower need to move out of an apartment to purchase a home.

________________________________
For the past year and a half, smaller apartment markets have garnered stronger rent growth than their large market counterparts. At the end of 2024, the annual change in effective asking rents among the nation’s largest 50 apartment markets (except New York) registered essentially flat at just 0.1%. Among smaller markets with an apartment base of about 24,000 units to just over 100,000 units, rent growth was considerably stronger at 1.4%.
This trend has been consistent since about mid-2023. While stronger rent growth among smaller markets can be inspired by lower inventory growth rates, the more likely scenario is that these markets are less likely to see drastic fluctuations in performance. Smaller markets display more resilience during hard times, missing the declines seen in bigger markets. At the same time, smaller locales don’t benefit from the same upside as larger markets during good times, either.

______________________________________
From this week’s Pensford Letter (2/3/25):
- Last week brought the most recent Core PCE print. While the headline came out at 2.8%, most economists would say it’s really more like 2.3%. The monthly Core PCE was just 0.2%, annualizing at 2.4%. That’s a better real time measure of inflation than comparing to where we were a year ago, which was 0.5% monthly rate (annualizing at 6%).
- The 3-month Core PCE average is 2.3%, the 6-month average is 2.3%, and the 9-month average is 2.3%. If we strip out the one 0.5% outlier print from a year ago, the average is…wait for it…2.3%.
- But you’ll say, “2.8% is above the Fed’s target!” Yes, but 2.8% is the mathematical consequence of measuring against a rapidly falling inflation a year ago, and the cost to immediately drive inflation to 2% is a lot of job losses (the Fed’s second mandate is full employment). If the Fed doesn’t expect inflation to reach 2% until the end of 2026, why is everyone acting like it needs to be 2% today?
- What about tariffs? Tariffs are cognitively easy to grasp, which is why they are so easy to point to as a boost to inflation. But they don’t happen in a vacuum. Let’s say I am selling my Taylor Swift T-shirt for $20 today. Tomorrow, I wake up and decide to change the price to $10,000. Is that inflation? No. Inflation happens after money exchanges hands. Someone has to pay that price in order for there to be inflation. When the price of something spikes, there is a drop in demand that partially offsets the cost increase. Or consumers shift to alternatives.
_____________________________________
The monthly Job Openings and Labor Turnover Survey (JOLTS) – released 2/4/25:
- What It Is: Think of it as a “help wanted” jobs sign for the entire economy.
- (1) Job Openings – How many jobs are available but not yet filled
- (2) Hires – How many people actually got hired
- (3) Quits & Layoffs – How many voluntarily left jobs (quits) or were let go (layoffs/firings)
- Available positions fell by 556,000 to 7.6 million, the well below the estimate for 8 million.
- What It Means: Weakness in the labor market will make the Fed more likely to cut rates in the months ahead
____________________________________
