
Consumer Price Inflation (CPI) Report – Release Date 1/15/24
- What It Is: Tracks the price change for of a basket of common items people use in their daily lives, such as food, clothing, housing, transportation, and healthcare.
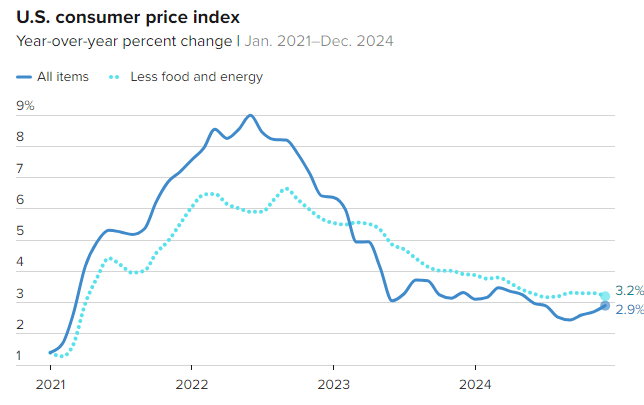
- Monthly reading was up 0.4% putting the 12-month inflation rate at 2.9%, in line with market expectations
- Core CPI (removing food and energy) was 3.2%, below the previous month and better than the 3.3% the market expected
- What It Means: The data coming in slightly better than consensus estimates increase the market odds for Fed cuts in the months ahead
Producer Price Inflation (PPI) Report – Release Date 1/14/24
- What It Is: Tracks how much businesses are charging for the things they make, before they reach consumers. It’s like looking at the prices in the factory, not the store.
- The monthly change was only 0.2% vs. expectations of 0.4%
- Core PPI was unchanged month-over-month (0.0%)
- What It Means: A cooler than expected PPI report, showing lower than expected inflation, gives the Fed more room to cut rates in the months ahead
This Pensford Letter – 1/13/24
Before everyone freaks out that rate cuts are causing the economy to surge, take a look at the monthly NFP averages since covid:
NFP (Non Farm Payroll Report) Monthly Average Of New Jobs:
2021: 604k
2022: 377k
2023: 251k
2024: 186k
Friday’s report showed a gain of 256k jobs – pretty much the average of 2023. Isn’t that a good thing? It’s still 60% lower than 2021. 600k per month is overheated. 250k per month isn’t.
The hiring rate fell to 3.3%, the lowest level since 2013. Professional services hiring is at 2009 levels. Private payrolls averaged 149k last year vs 192k in 2023. Plus, government/healthcare still made up 40% of the jobs – let’s see how that holds up under the DOGE microscope. Call me back in four months after revisions. This feels mostly like positive business sentiment from the Republican sweep. And more like stabilization, not spiking.
